NCERT Solutions for Class 8 Maths Chapter 15 Exercise 15.2 Introduction to graphs in English Medium and Hindi Medium in updated form to use online. All the solutions are prepared in simplified way so that students can understand it easily.
NCERT Solutions for Class 8 Maths Chapter 15 Exercise 15.2
If you need solutions in Hindi, Click for Hindi Medium solutions of 8 Maths Exercise 15.2
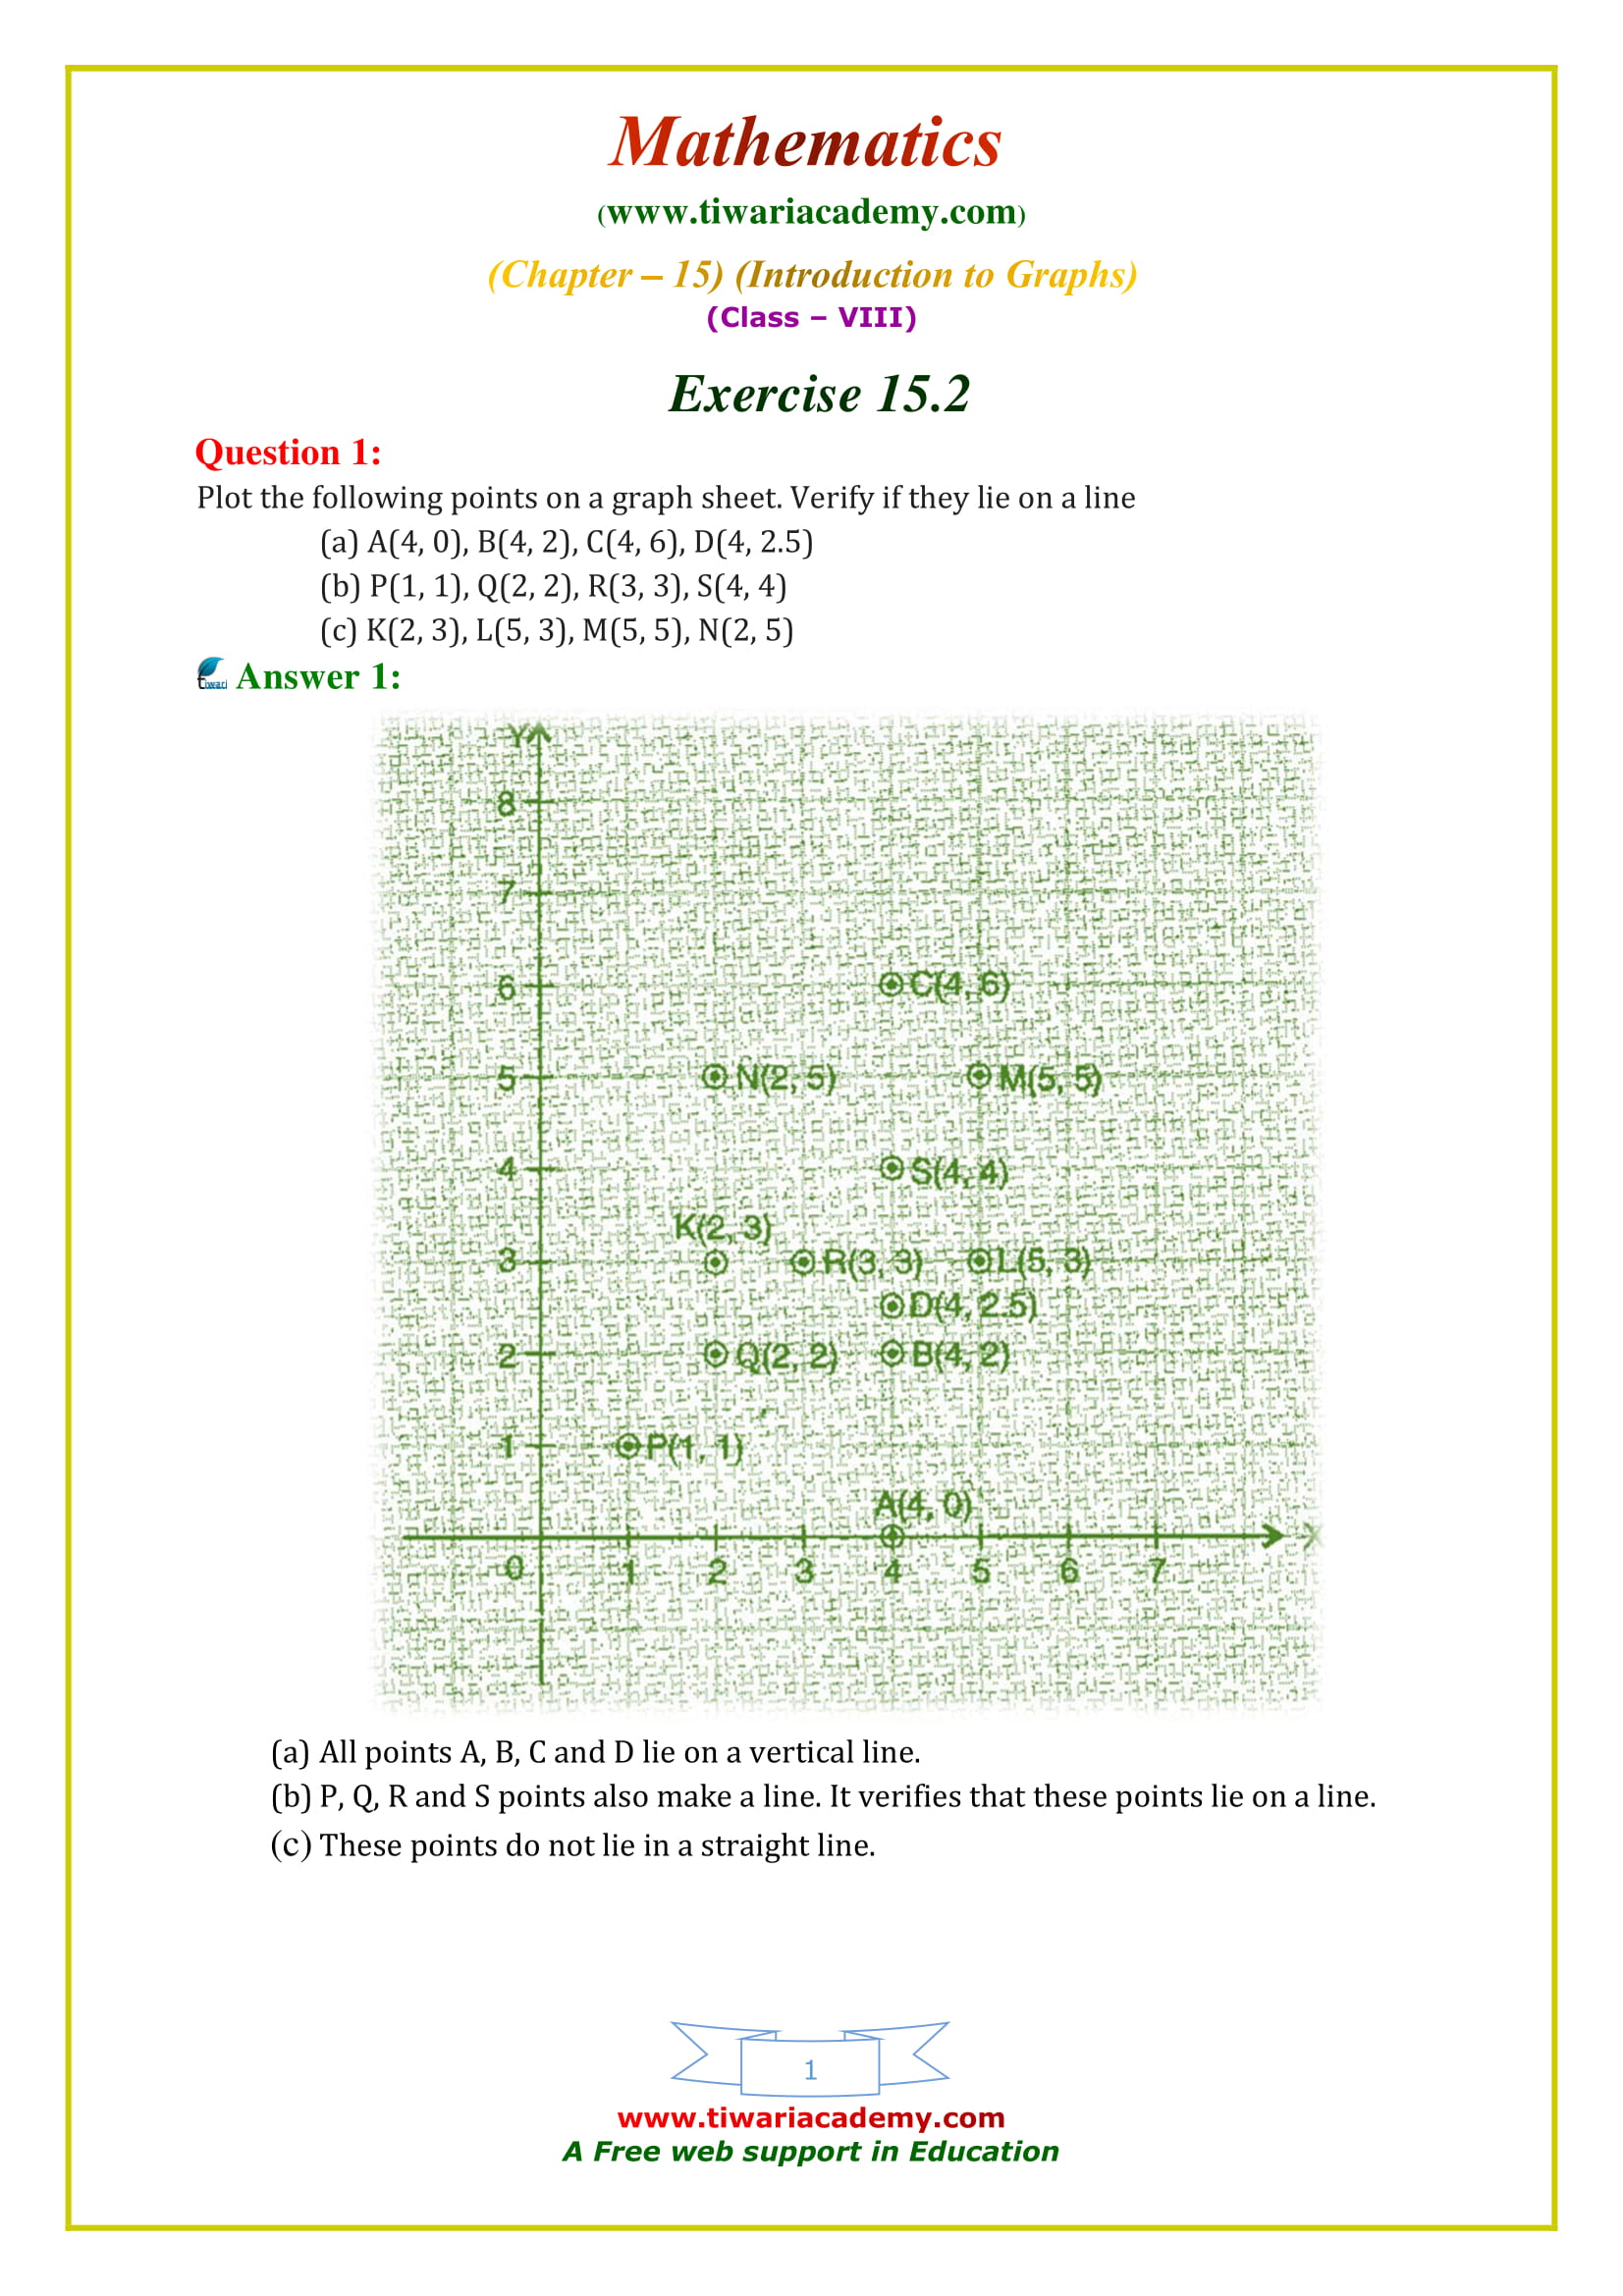
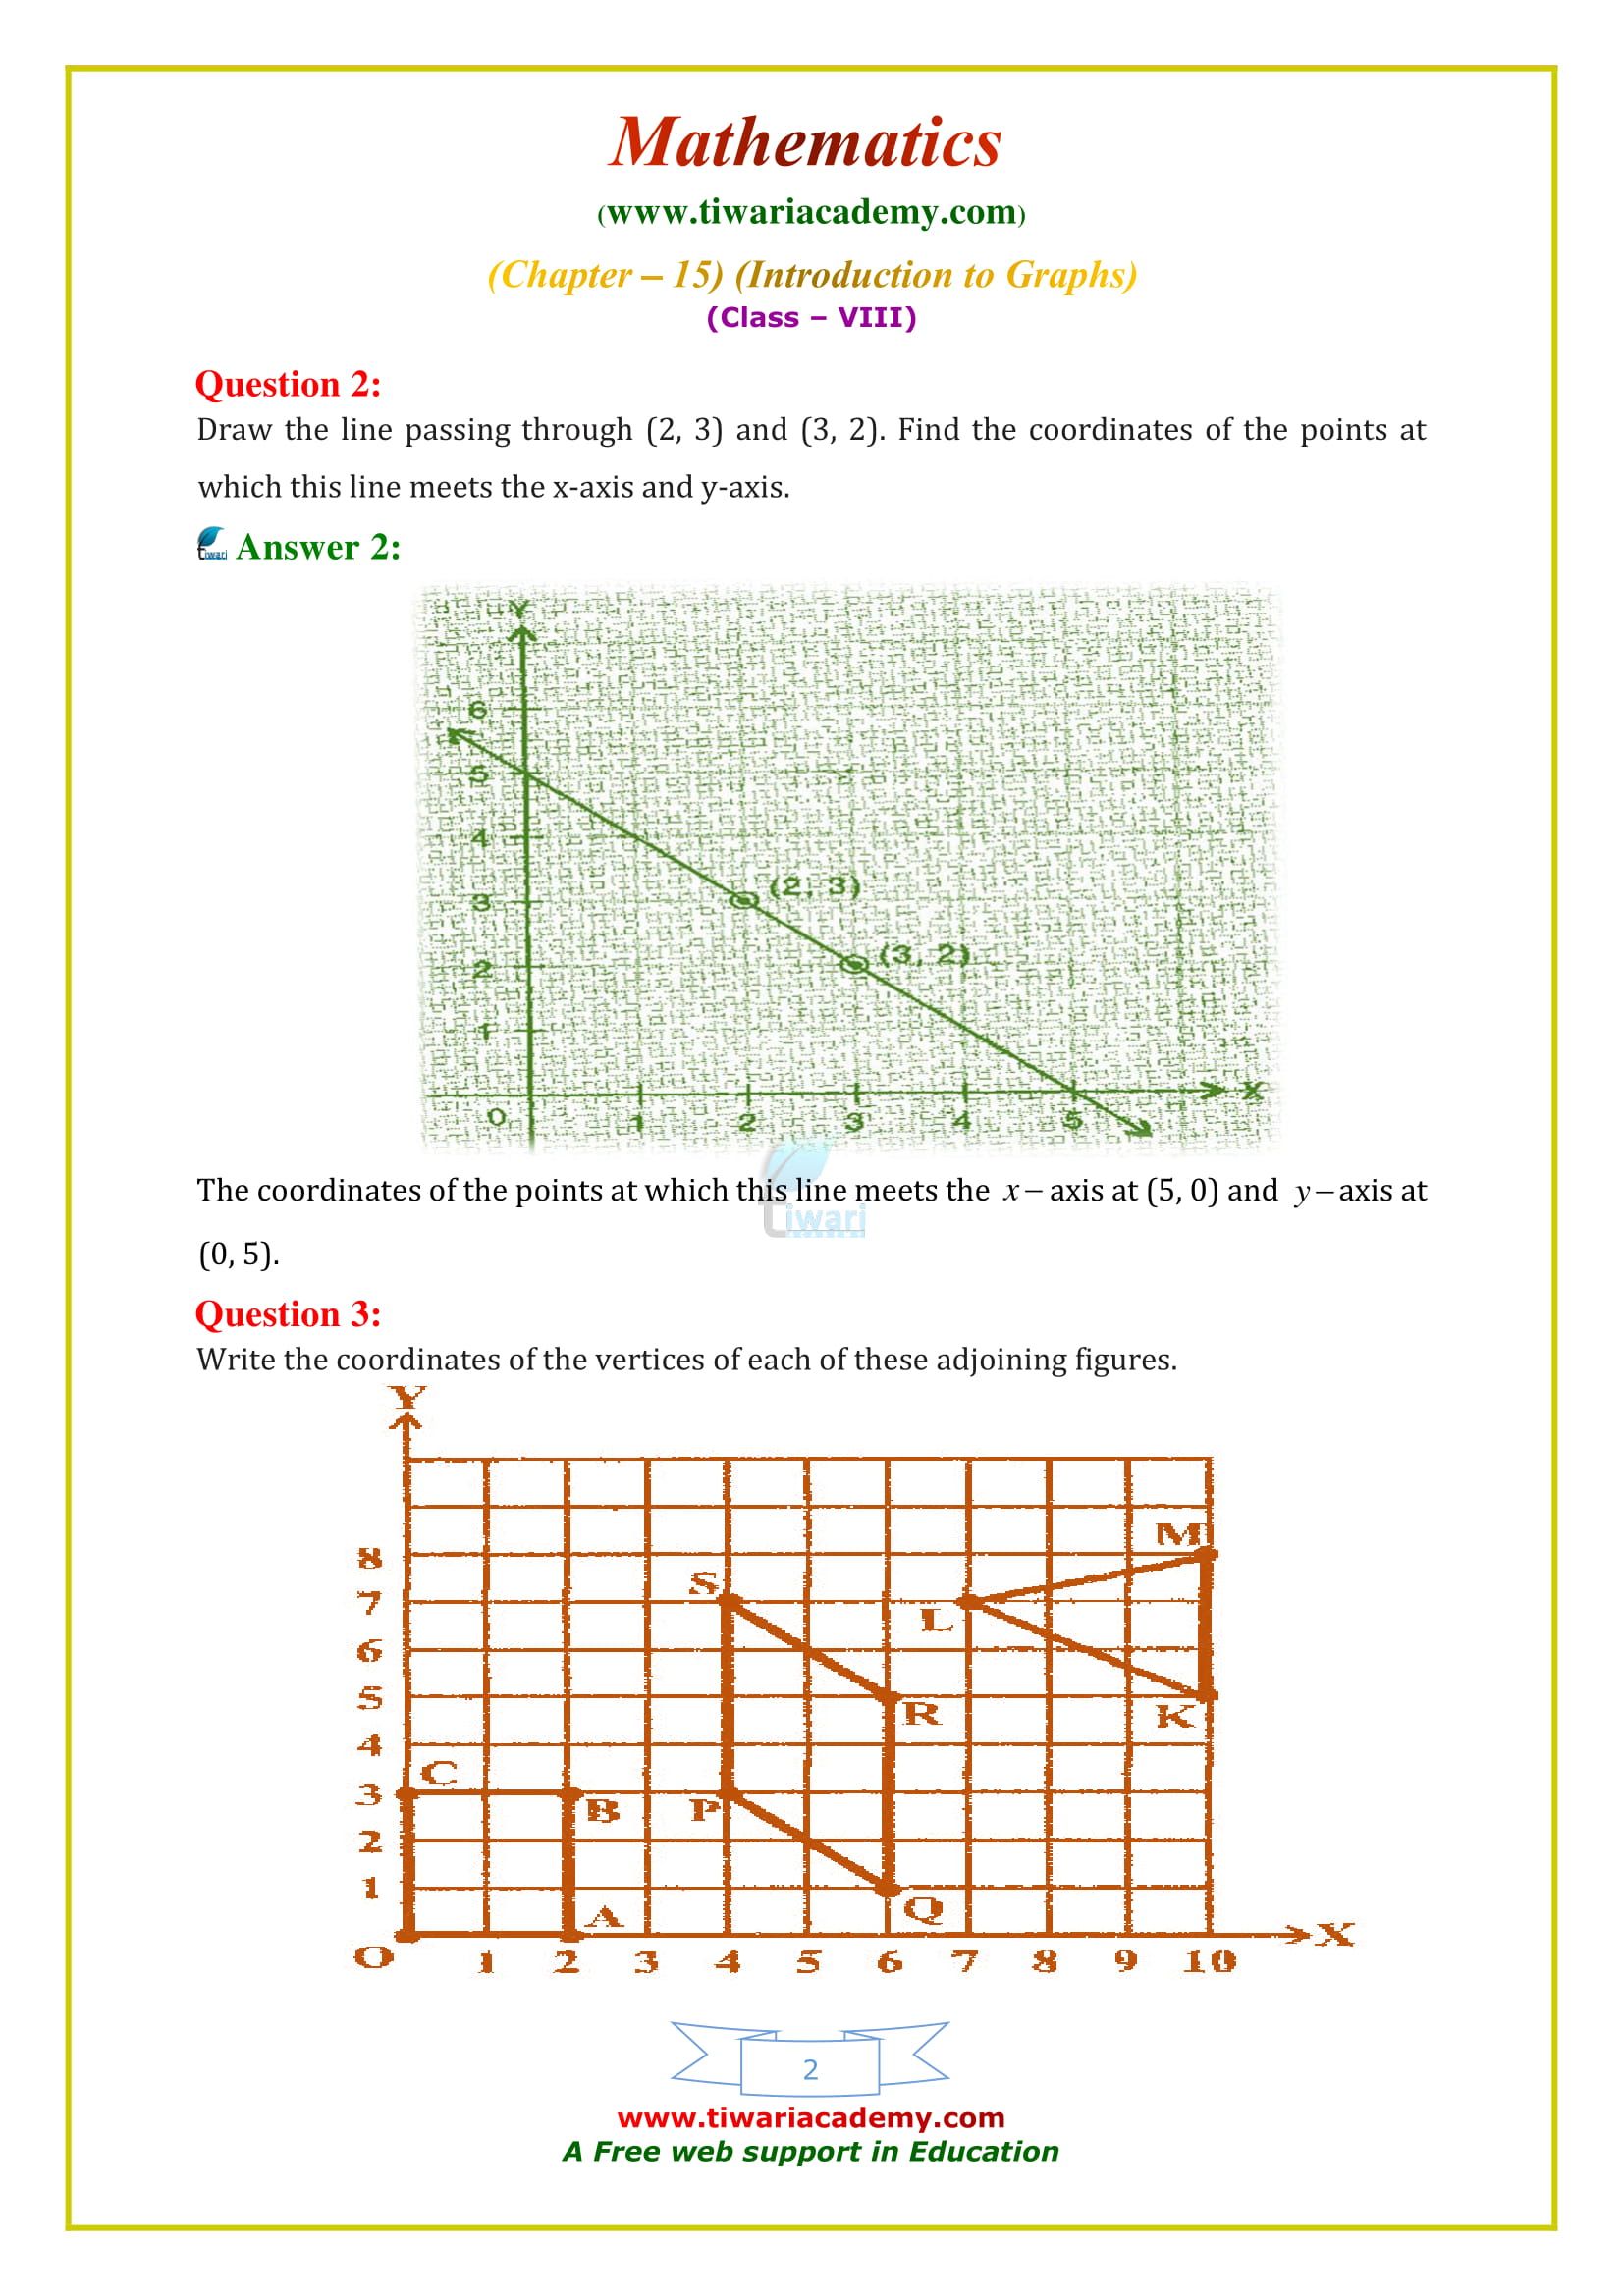
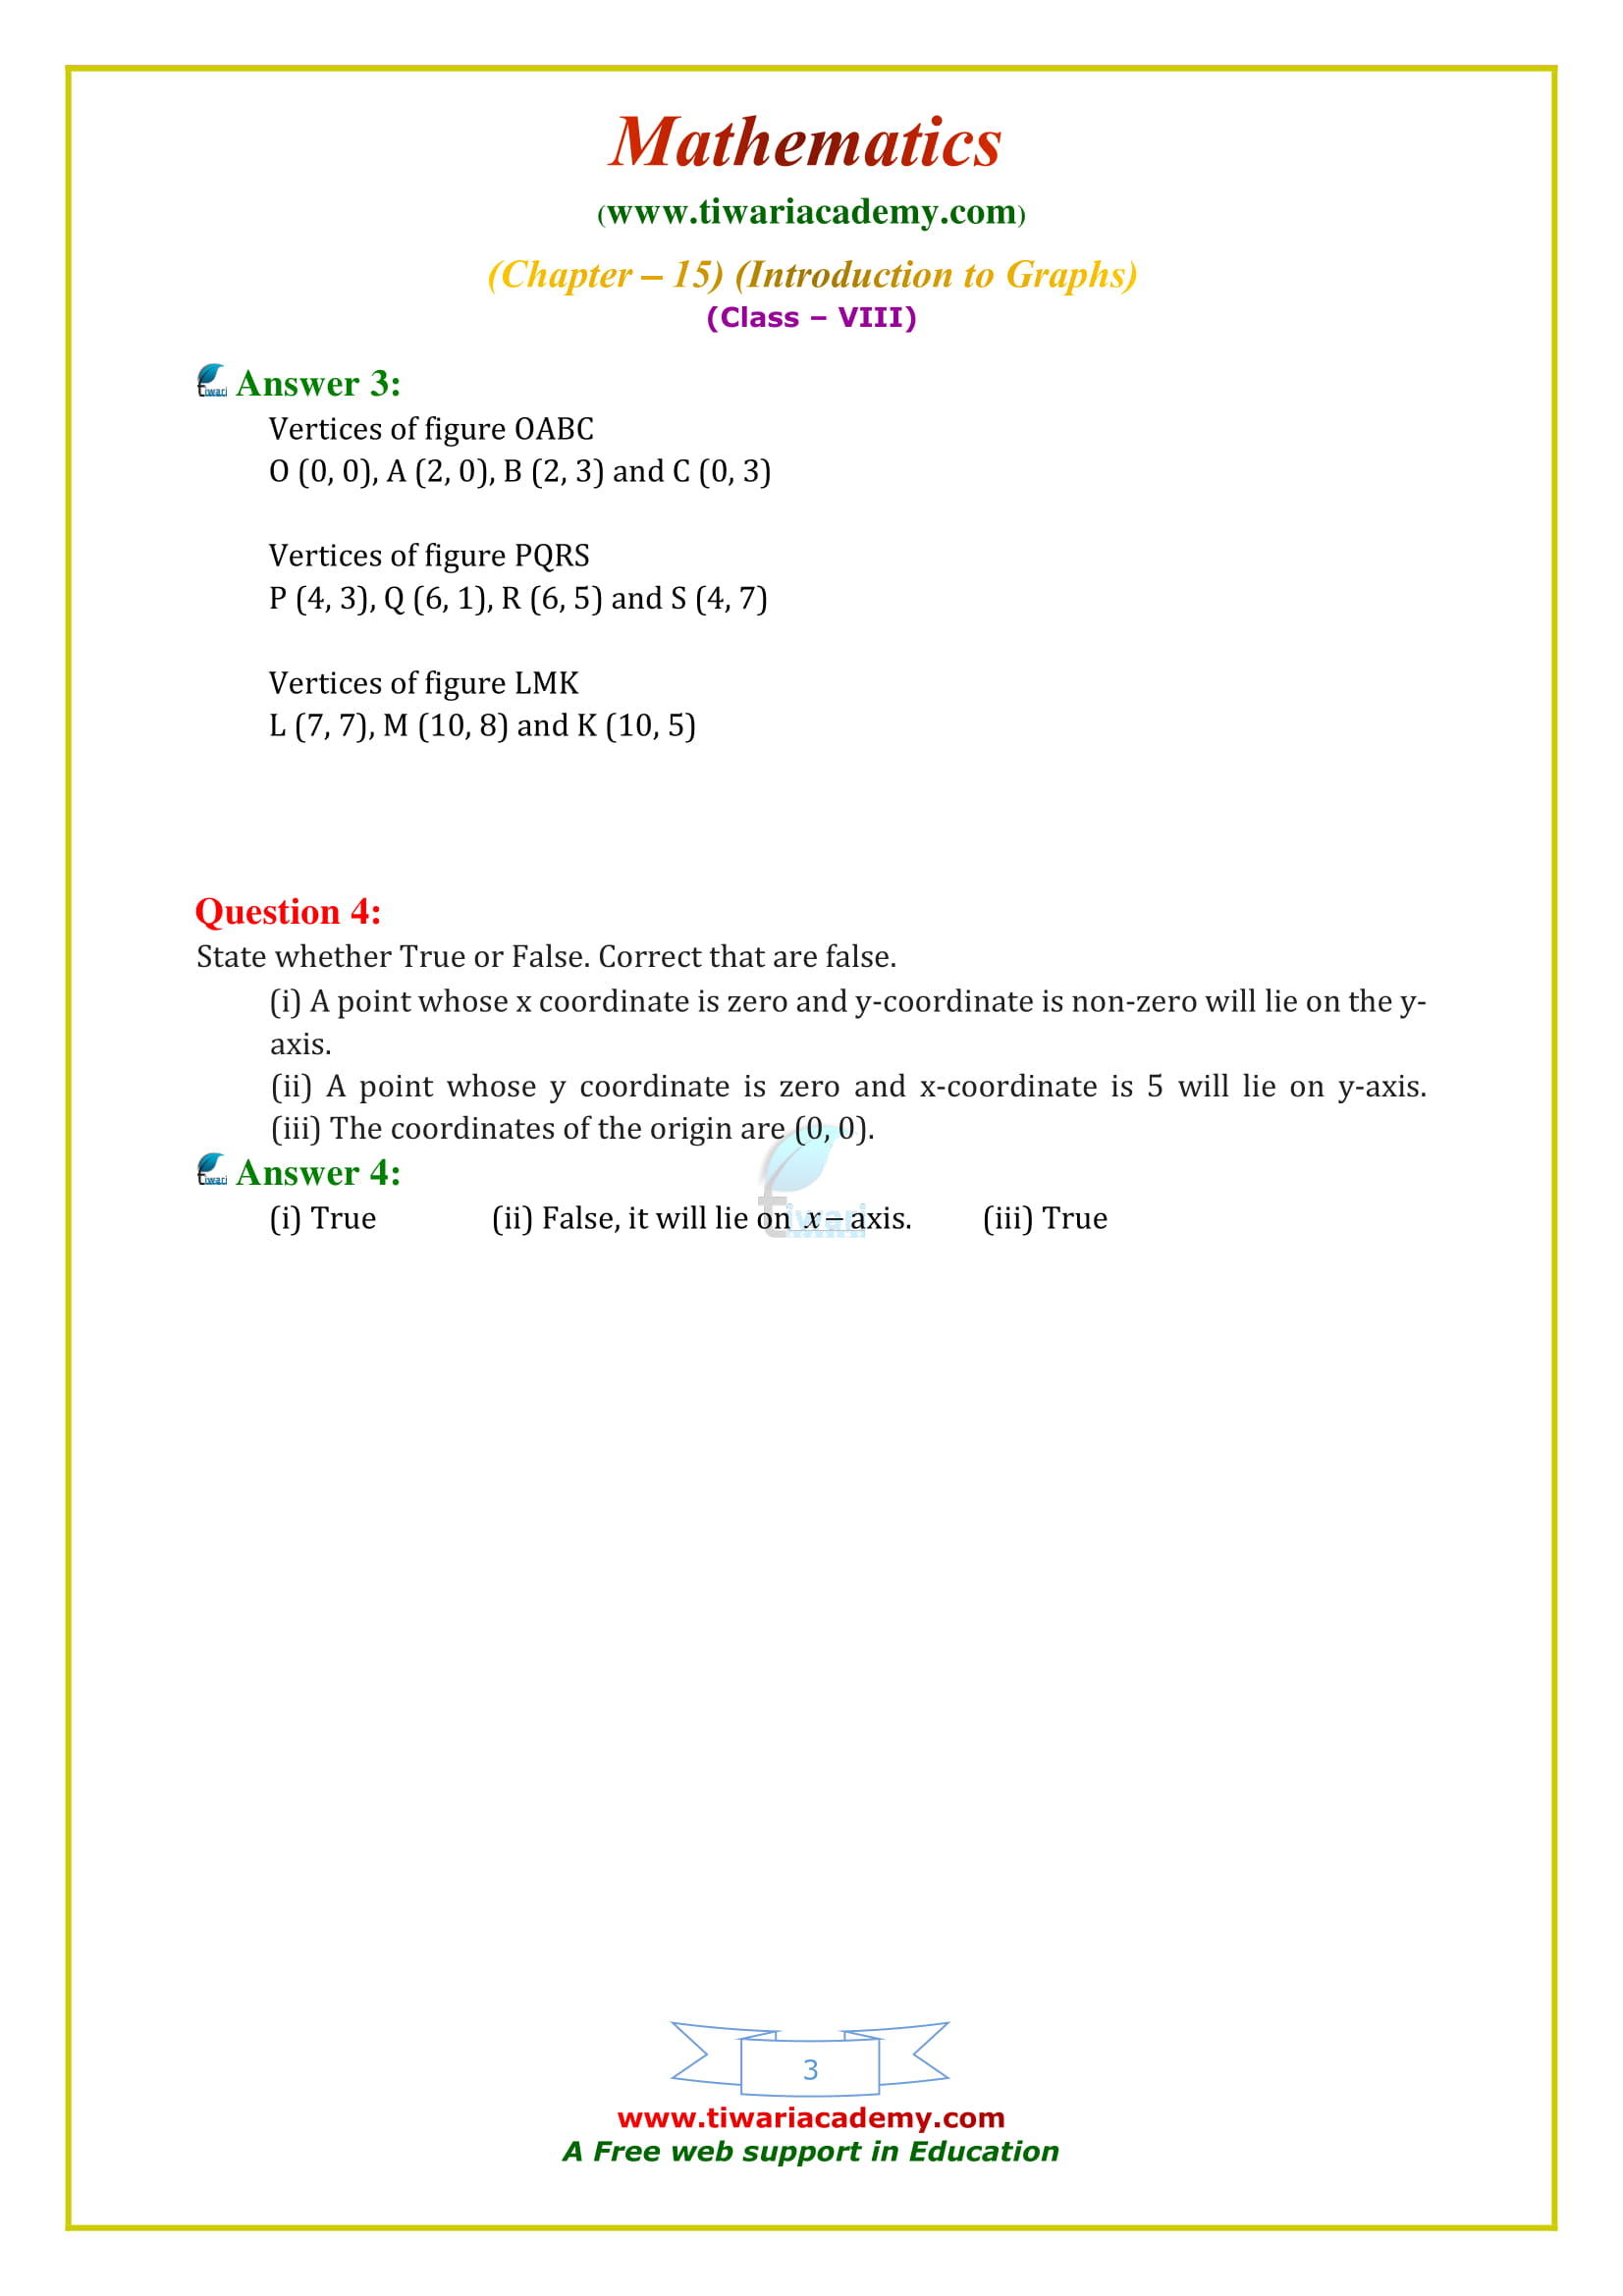
8 Maths Chapter 15 Exercise 15.2 in Hindi
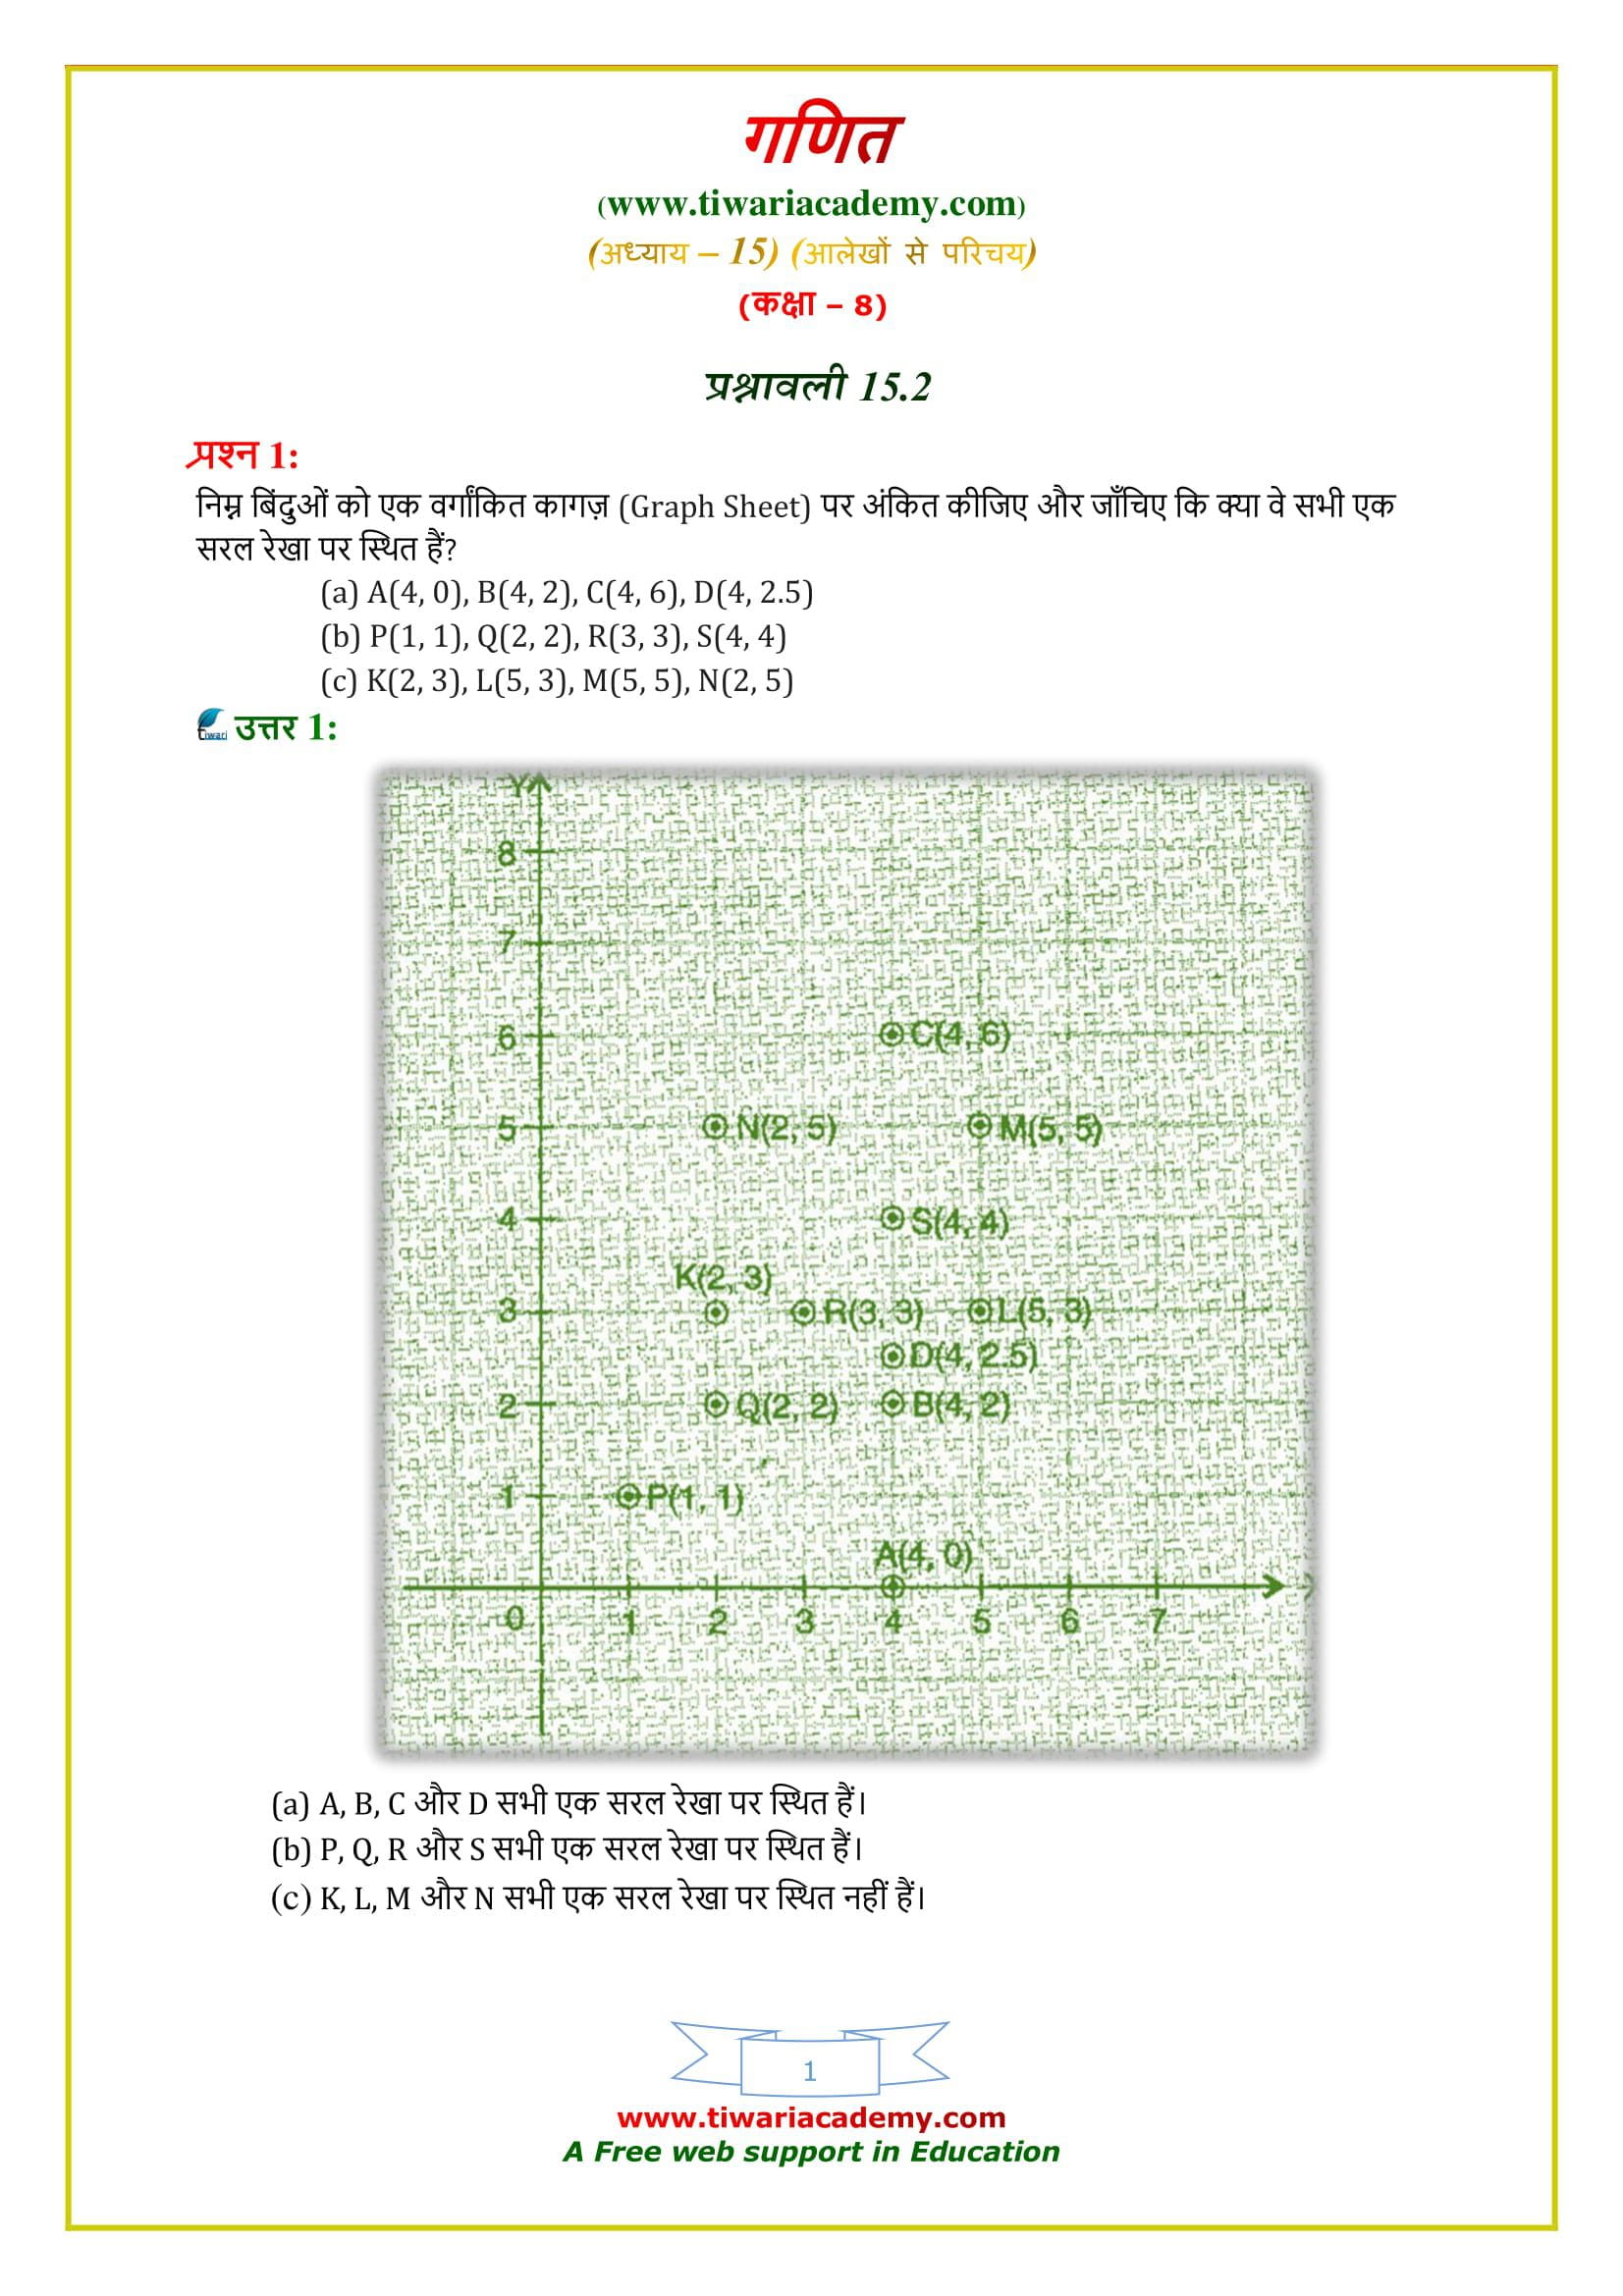
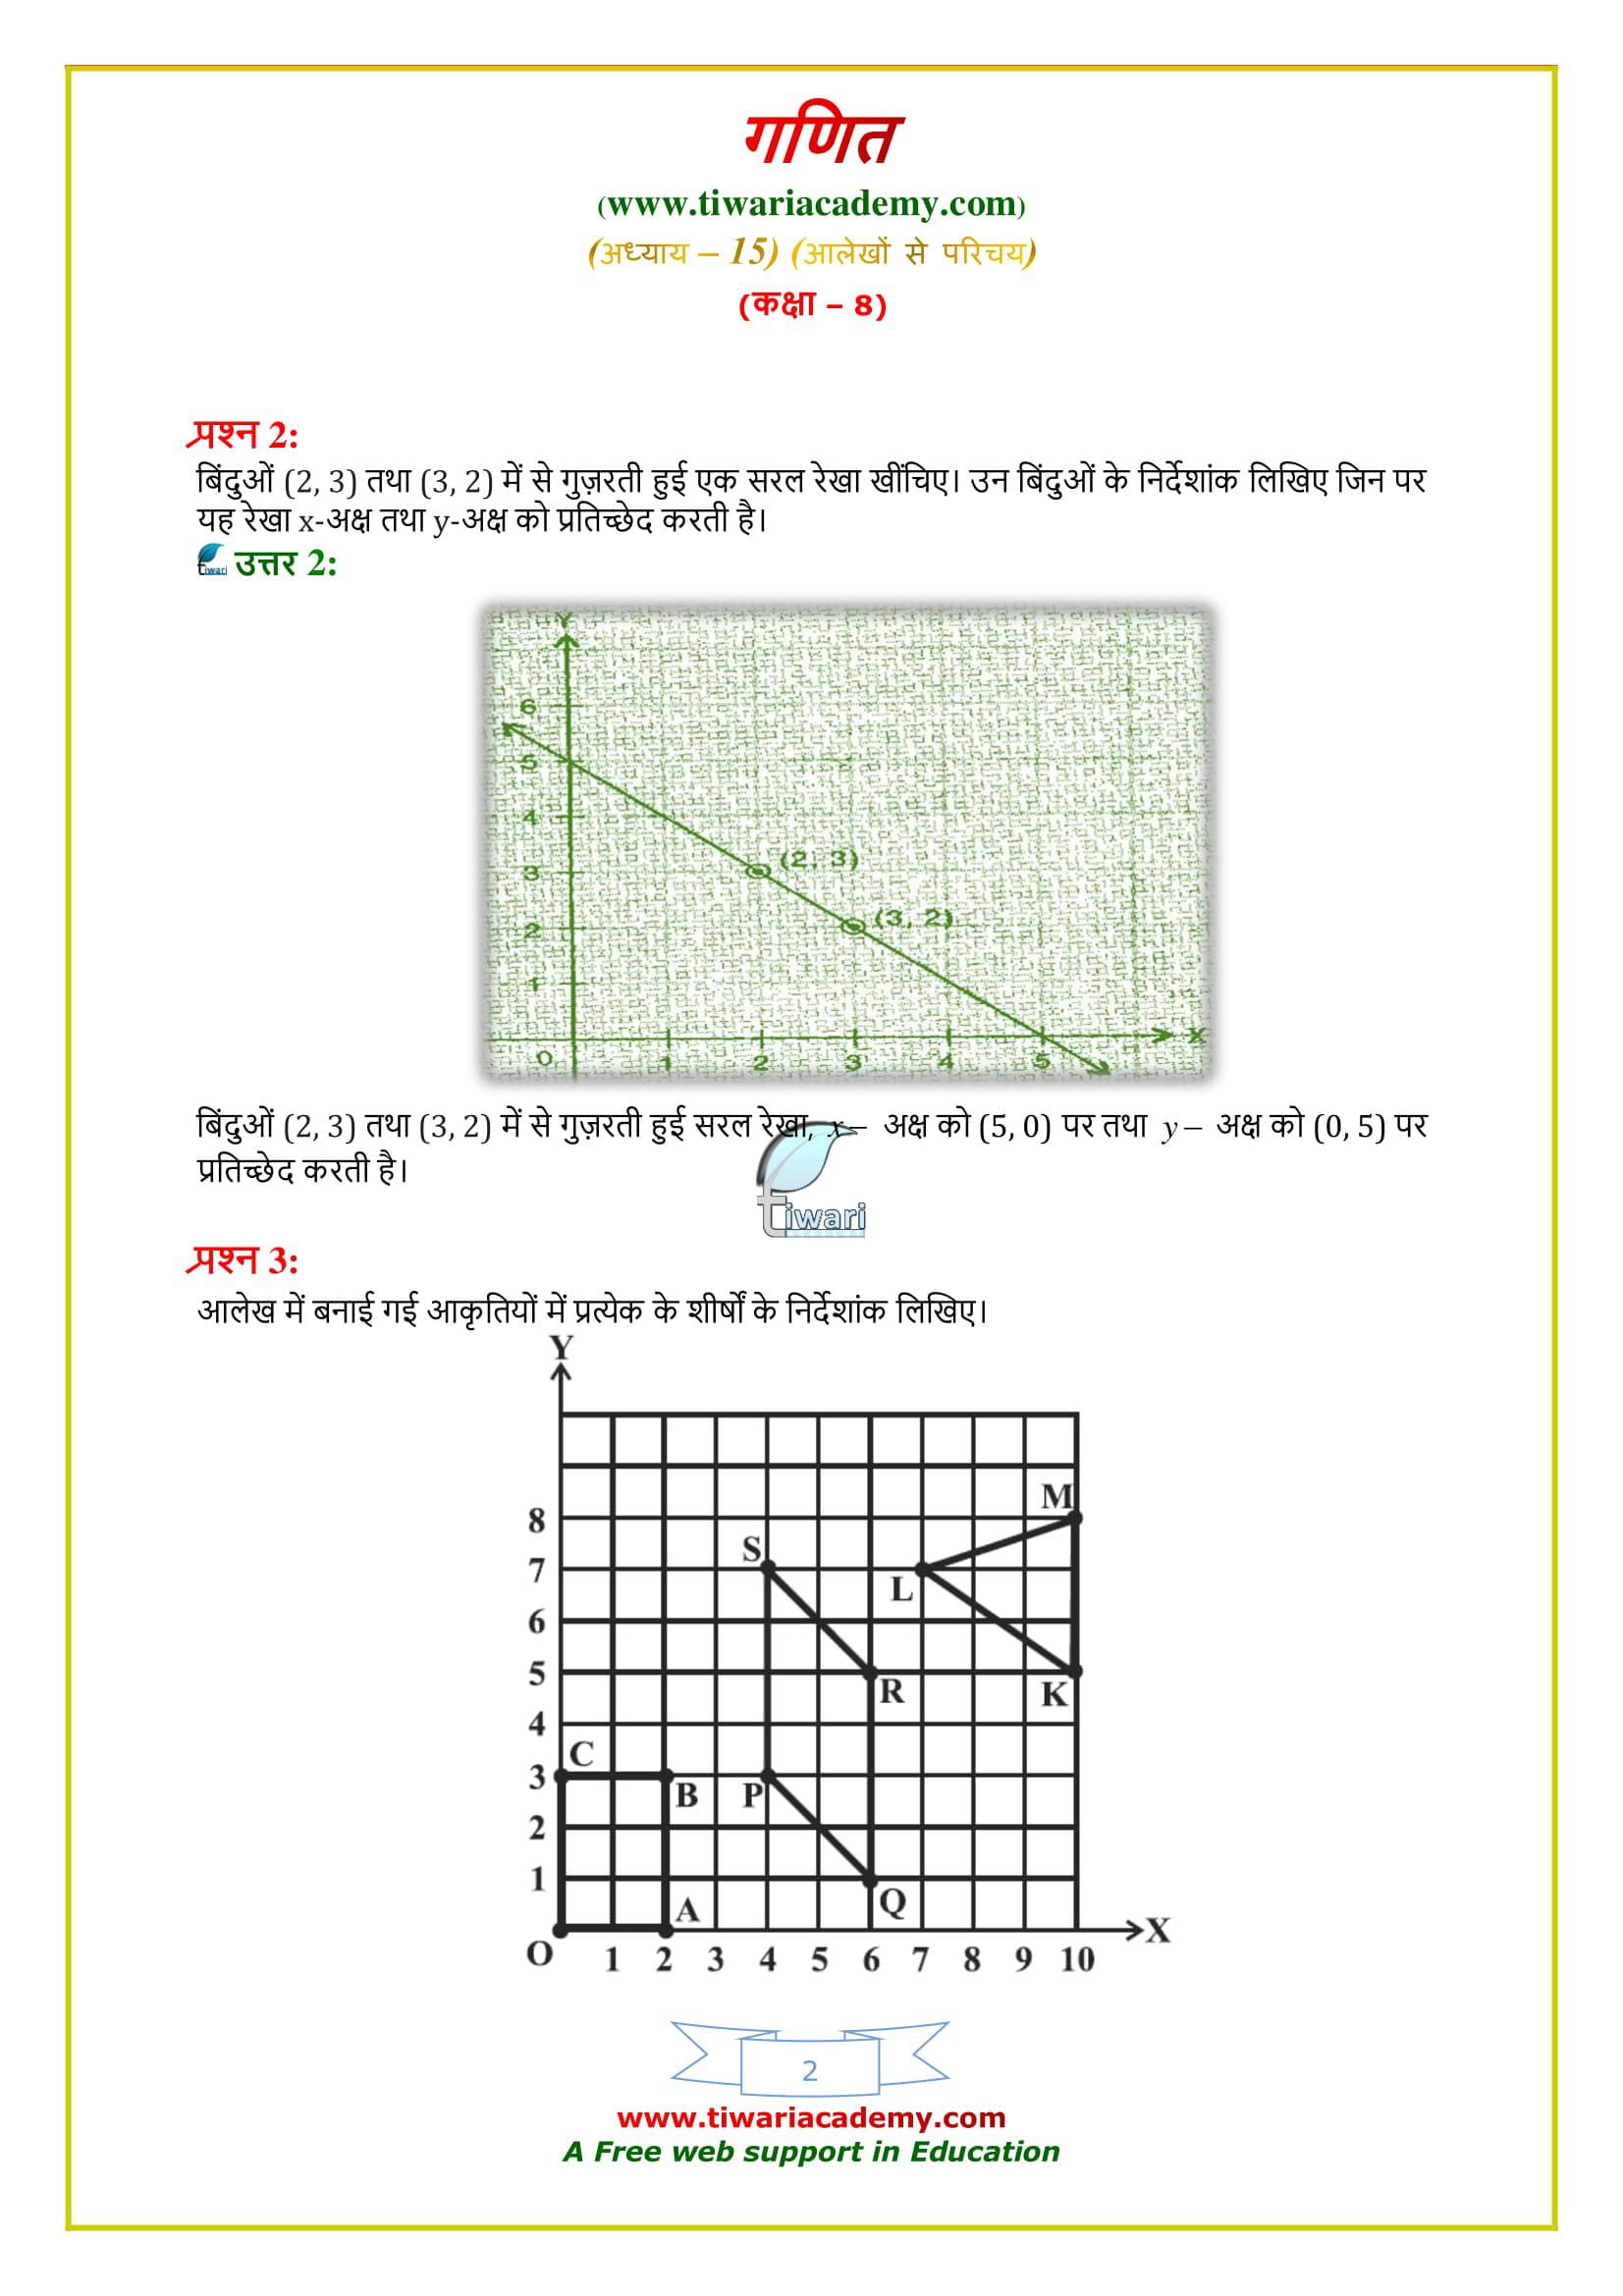
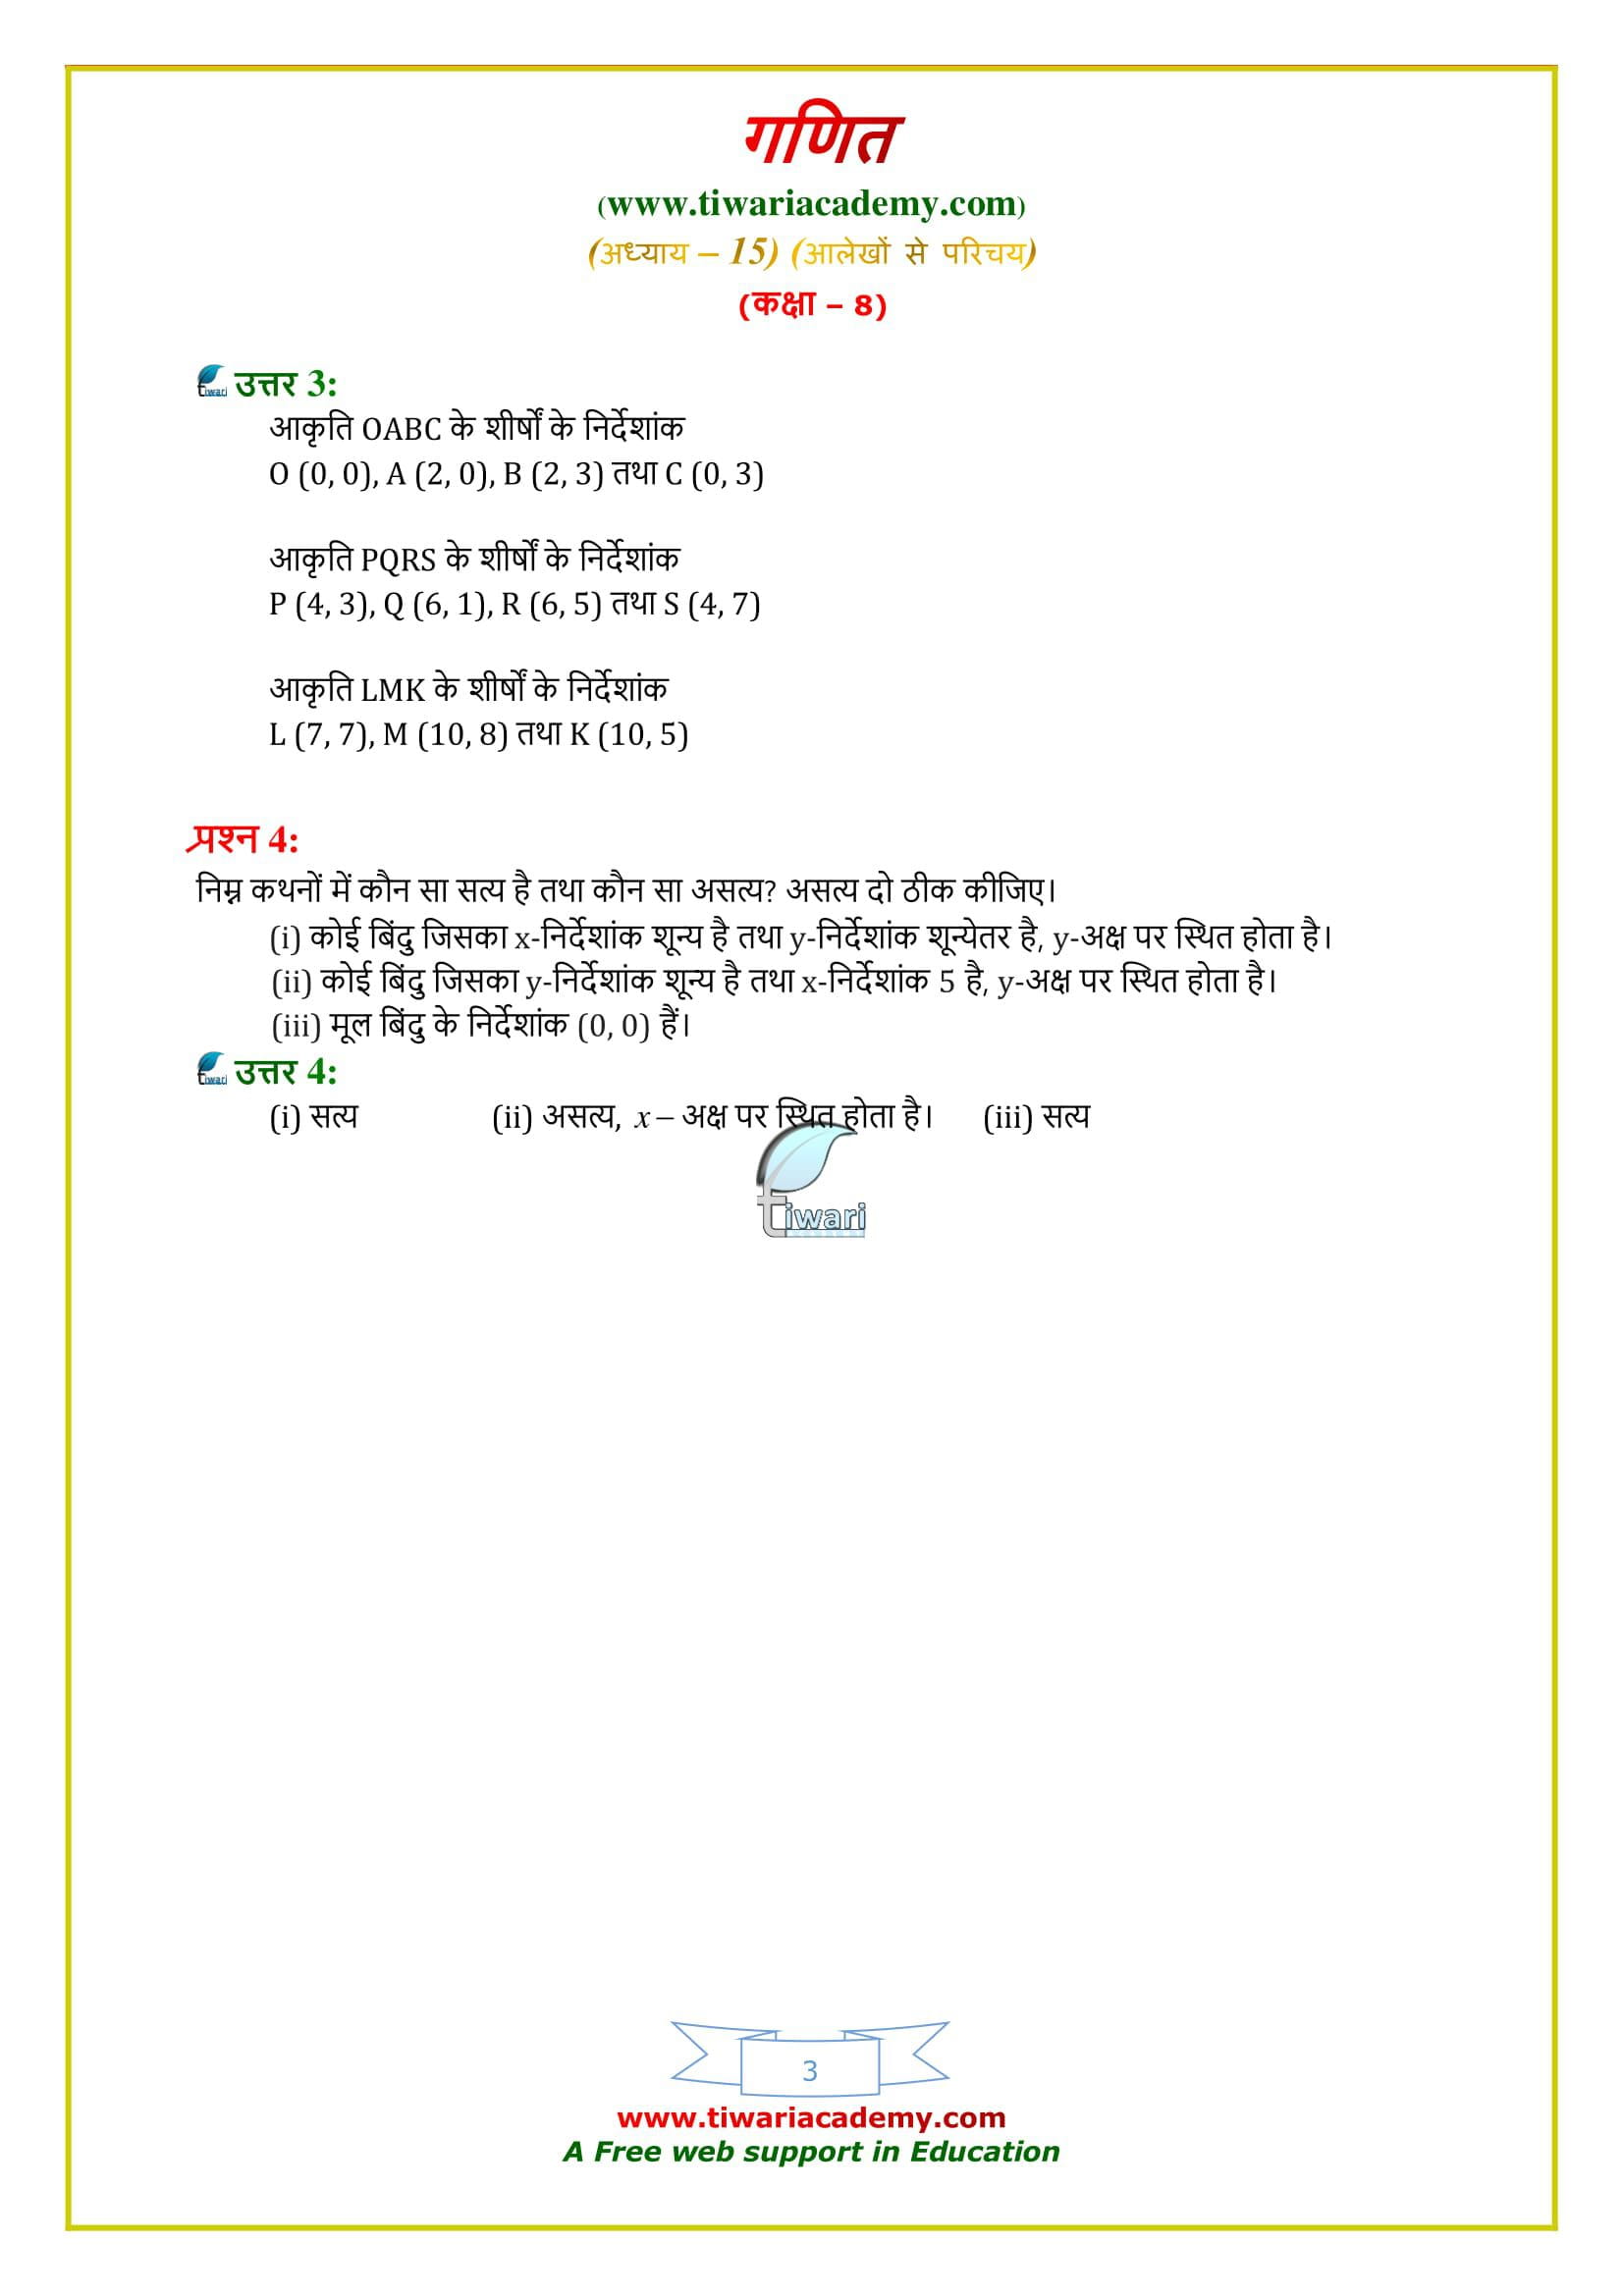
To get the solutions in English, Click for English Medium solutions.
Class 8 Maths Chapter 15 – Important Questions
Extra Questions for Practice
1. Monthly salary of a person is ₹ 15000. The central angle of the sector representing his expenses on food and house rent on a pie chart is 60°. The amount he spends on food and house rent is
(a) ₹ 5000 (b) ₹ 2500 (c) ₹ 6000 (d) ₹ 9000
2. Rohan and Mayank are playing with 5 cards as shown in the figure. What is the probability of Rohan picking a card without seeing, that has the number 2 on it?
(a) 2/5 (b) 1/5 (c) 3/5 (d) 4/5
3. What is the central angle of the sector (in the above pie chart) representing hormones enzymes and other proteins.
(a) 120° (b) 144° (c) 156° (d) 176°
4. A graph showing two sets of data simultaneously is known as
(a) Pictograph (b) Histogram (c) Pie chart (d) Double bar graph
5. If the fifth class interval is 60 – 65, fourth class interval is 55 – 60, then the first class interval is 45 –50. Is it true or false?
6. The central angle of the sectors in a pie chart will be a fraction of 360°. Is it true or false?
7. The weekly wages (in ₹) of 30 workers in a factory are 830, 835, 890, 810, 835, 836, 869, 845, 898, 890, 820, 860, 832, 833, 855, 845, 804, 808, 812, 840, 885, 835, 835, 836, 878, 840, 868, 890, 806, 840. Using tally marks, make a frequency distribution table with class intervals 800 – 810, 810 – 820 and so on.
8. The probability of getting number 6 in a throw of a dice is 1/6. Similarly, the probability of getting a number 5 is 1/5. Is it true or false? Give reason in support your answer.
9. Ajit can ride a scooter constantly at a speed of 30 km/hour. Draw a time-distance graph for this situation. Use it to find (i) the time taken by Ajit to ride 75 km. (ii) the distance covered by Ajit in 3.5 hours.

