Download NCERT Solutions for Class 9 Maths Chapter 14 Exercise 14.3 statistics in English Medium and Hindi Medium free to use it online or offline. NCERT Books and NCERT Solutions for Class 9 Maths based on Current CBSE Curriculum for 2020 – 2021 are given. Other exercises like Exercise 14.1 or Exercise 14.2 or Exercise 14.4 are given to use online or download to use it offline.
NCERT Solutions for Class 9 Maths Chapter 14 Exercise 14.3
If you need solutions in Hindi, Click for Hindi Medium solutions of 10 Maths Exercise 14.3
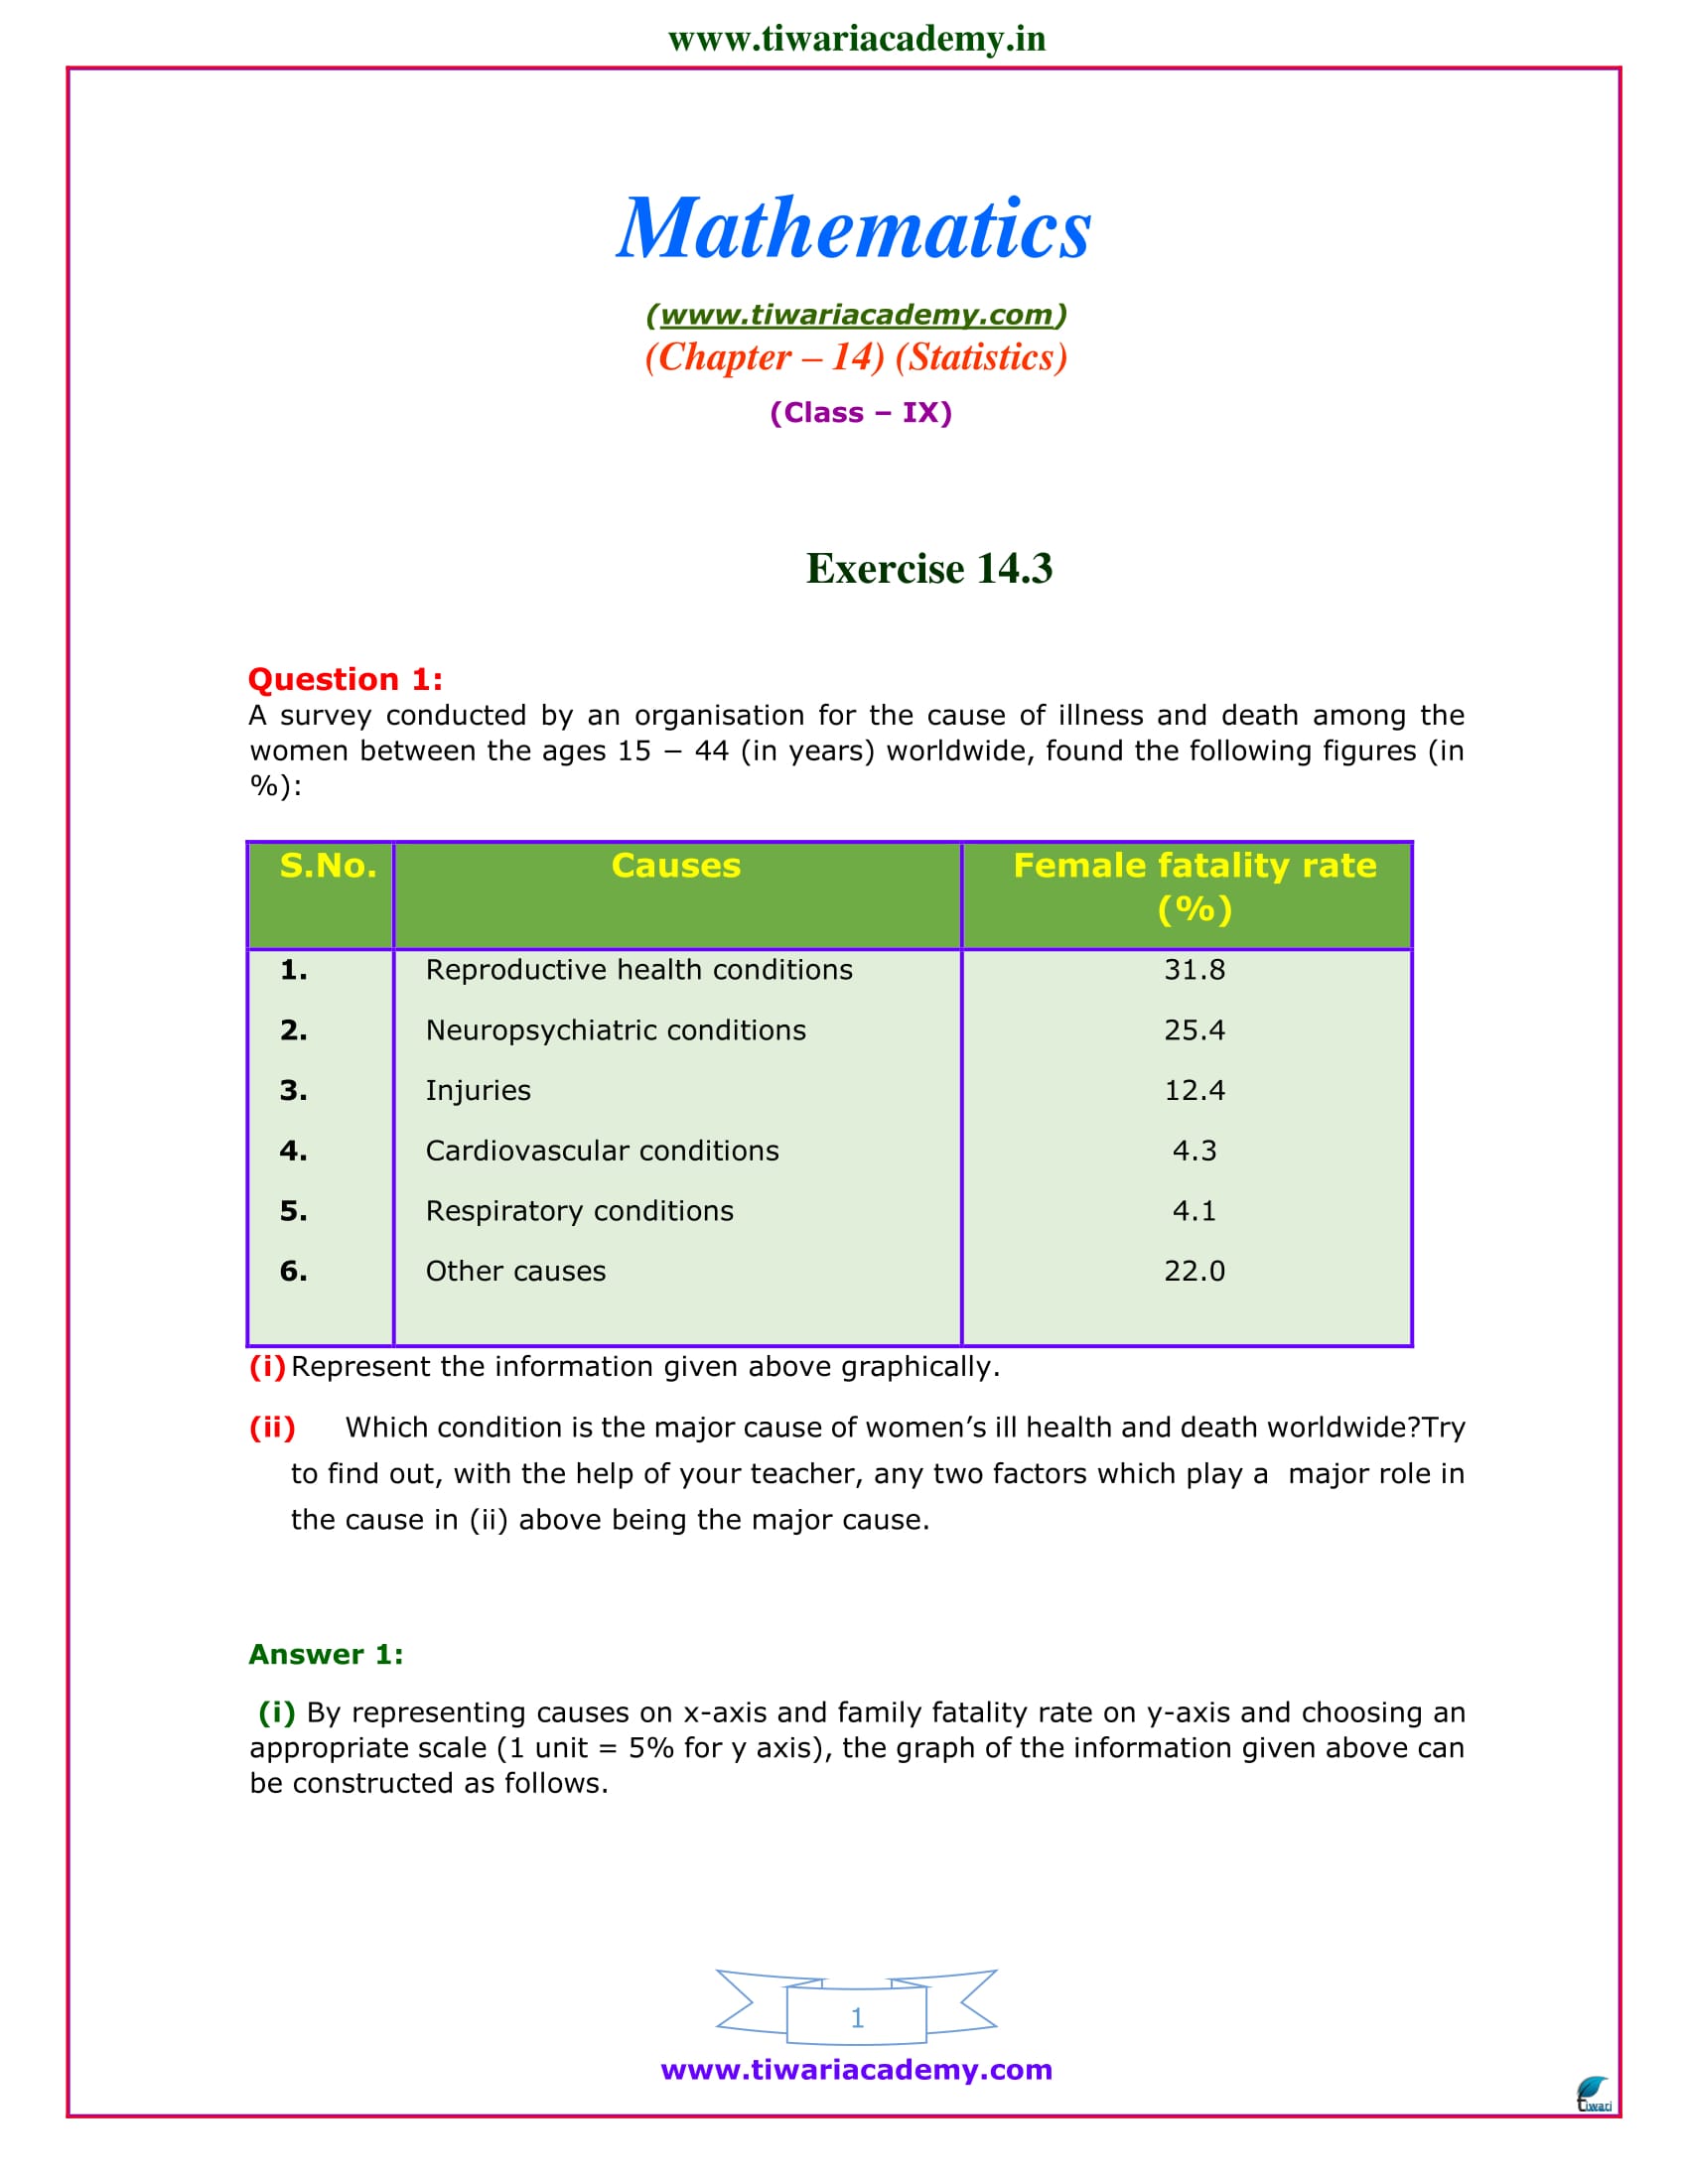
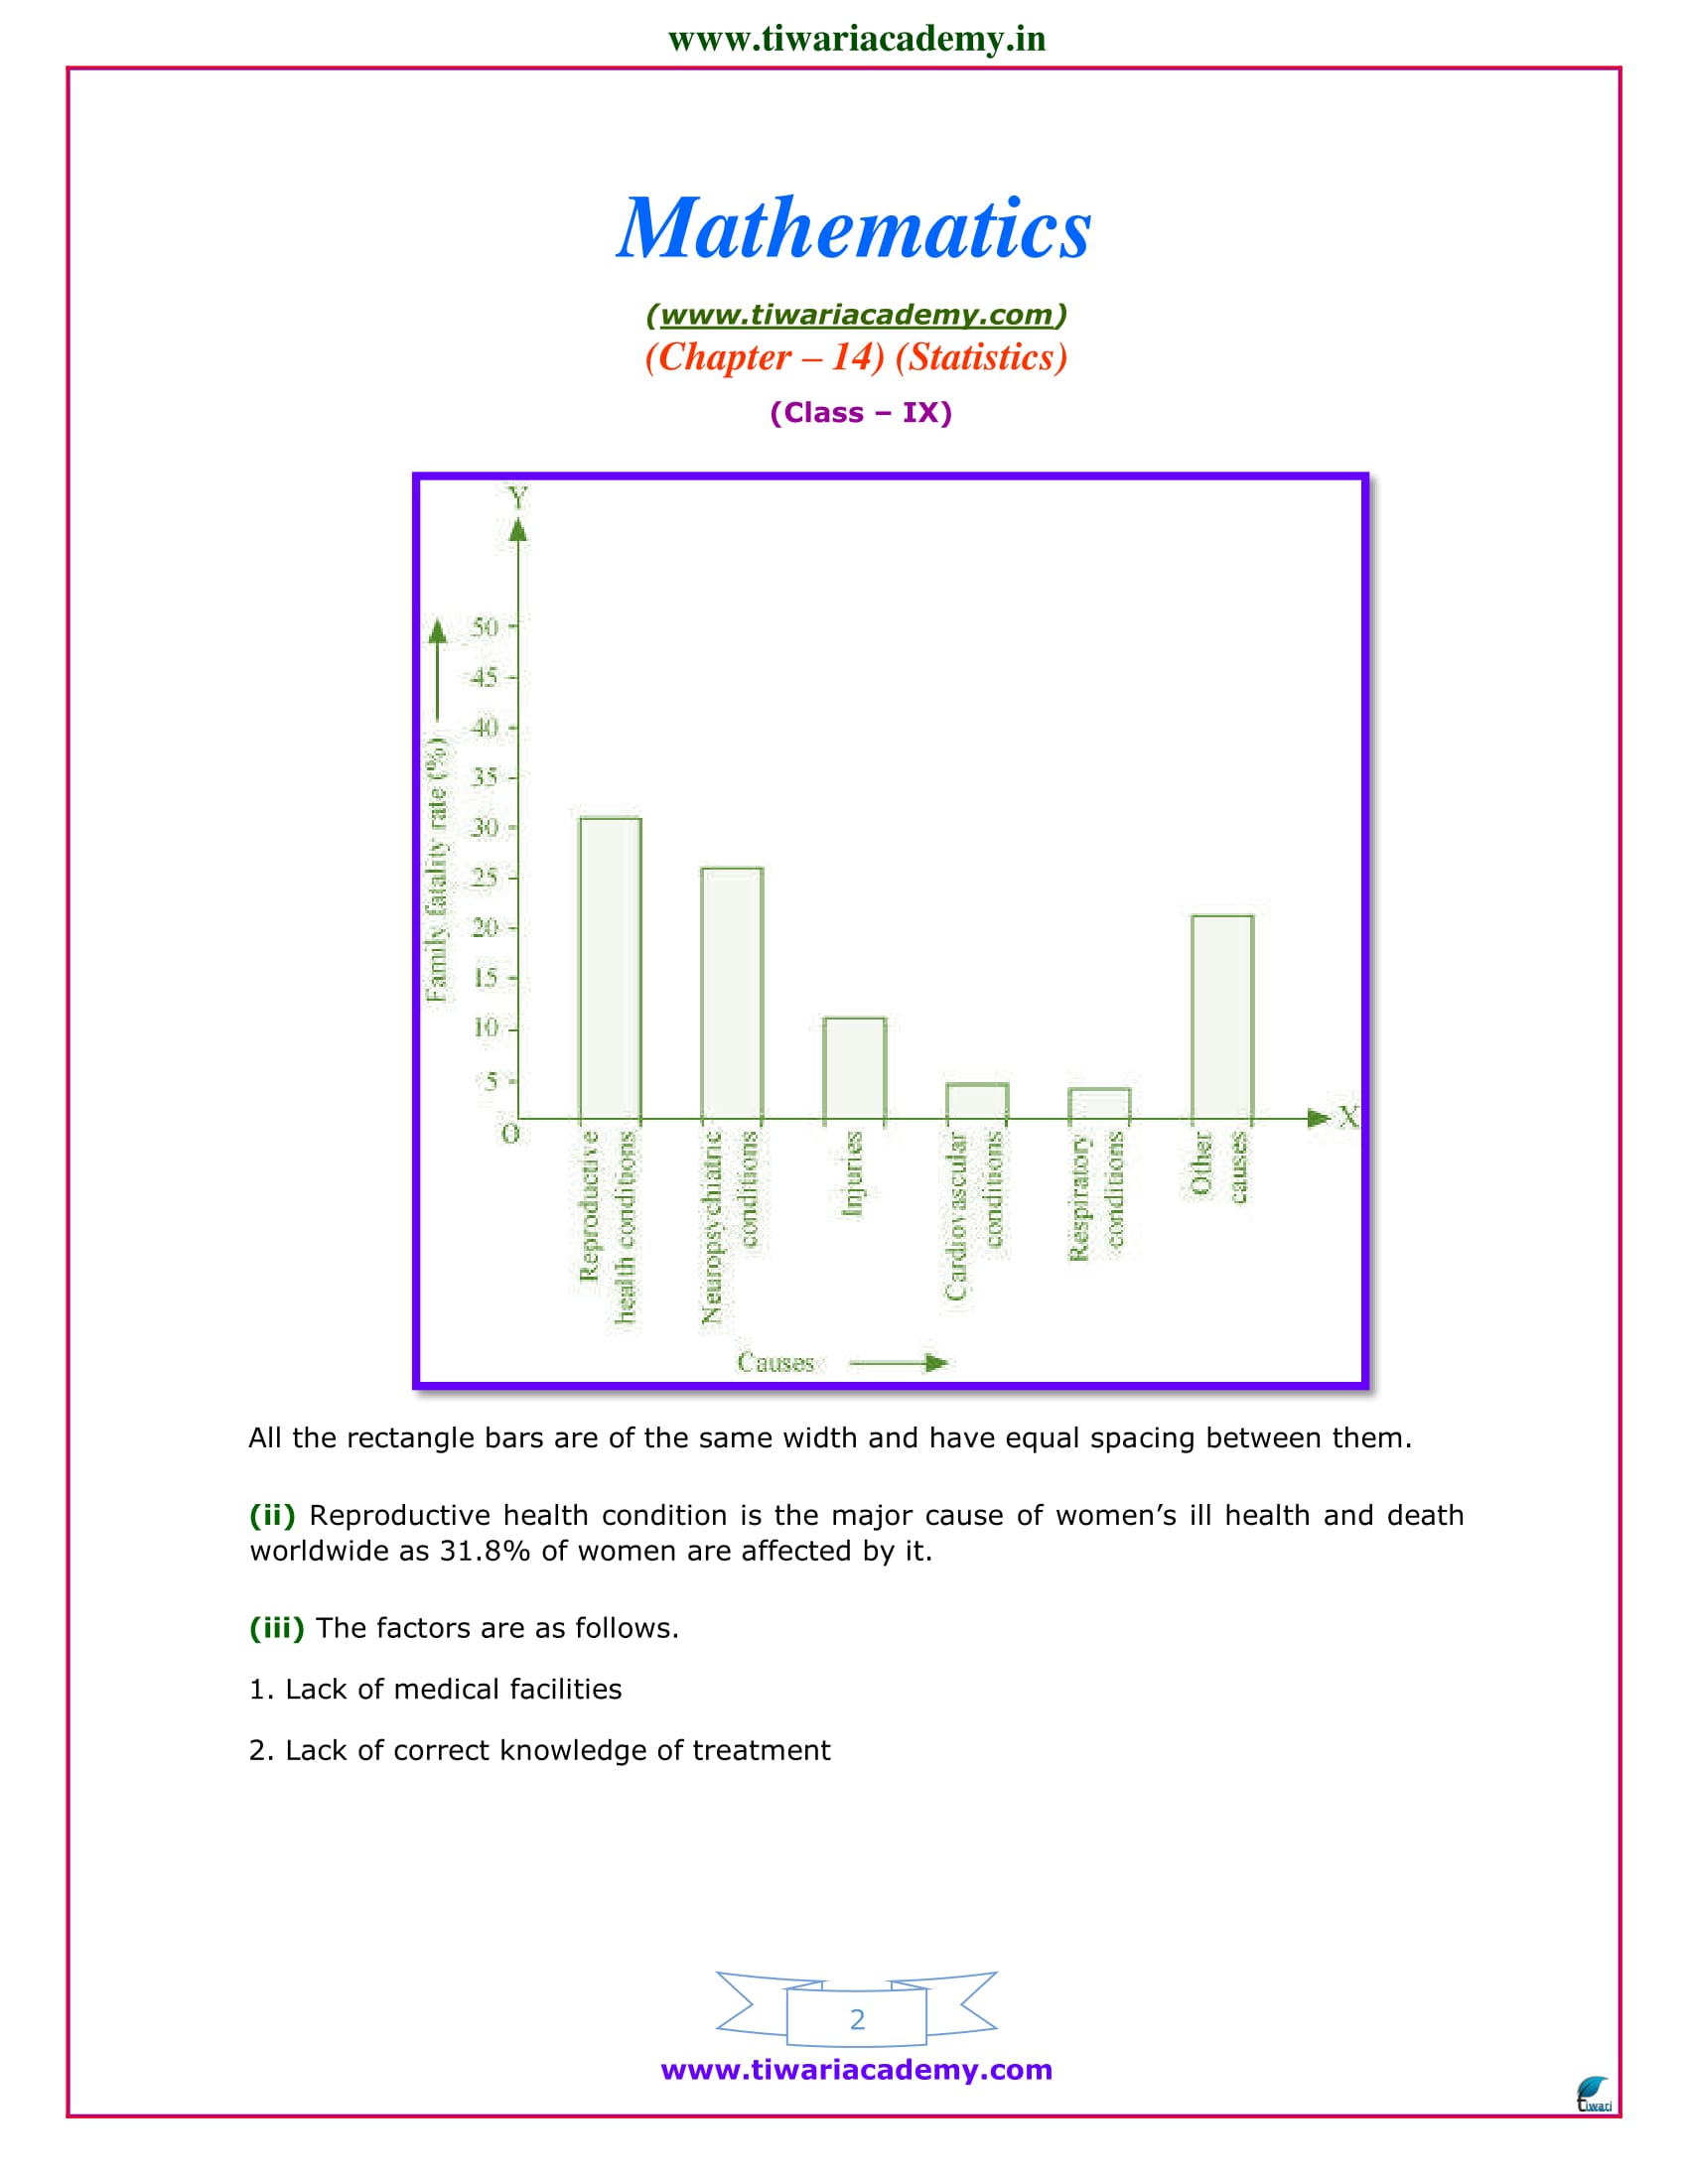
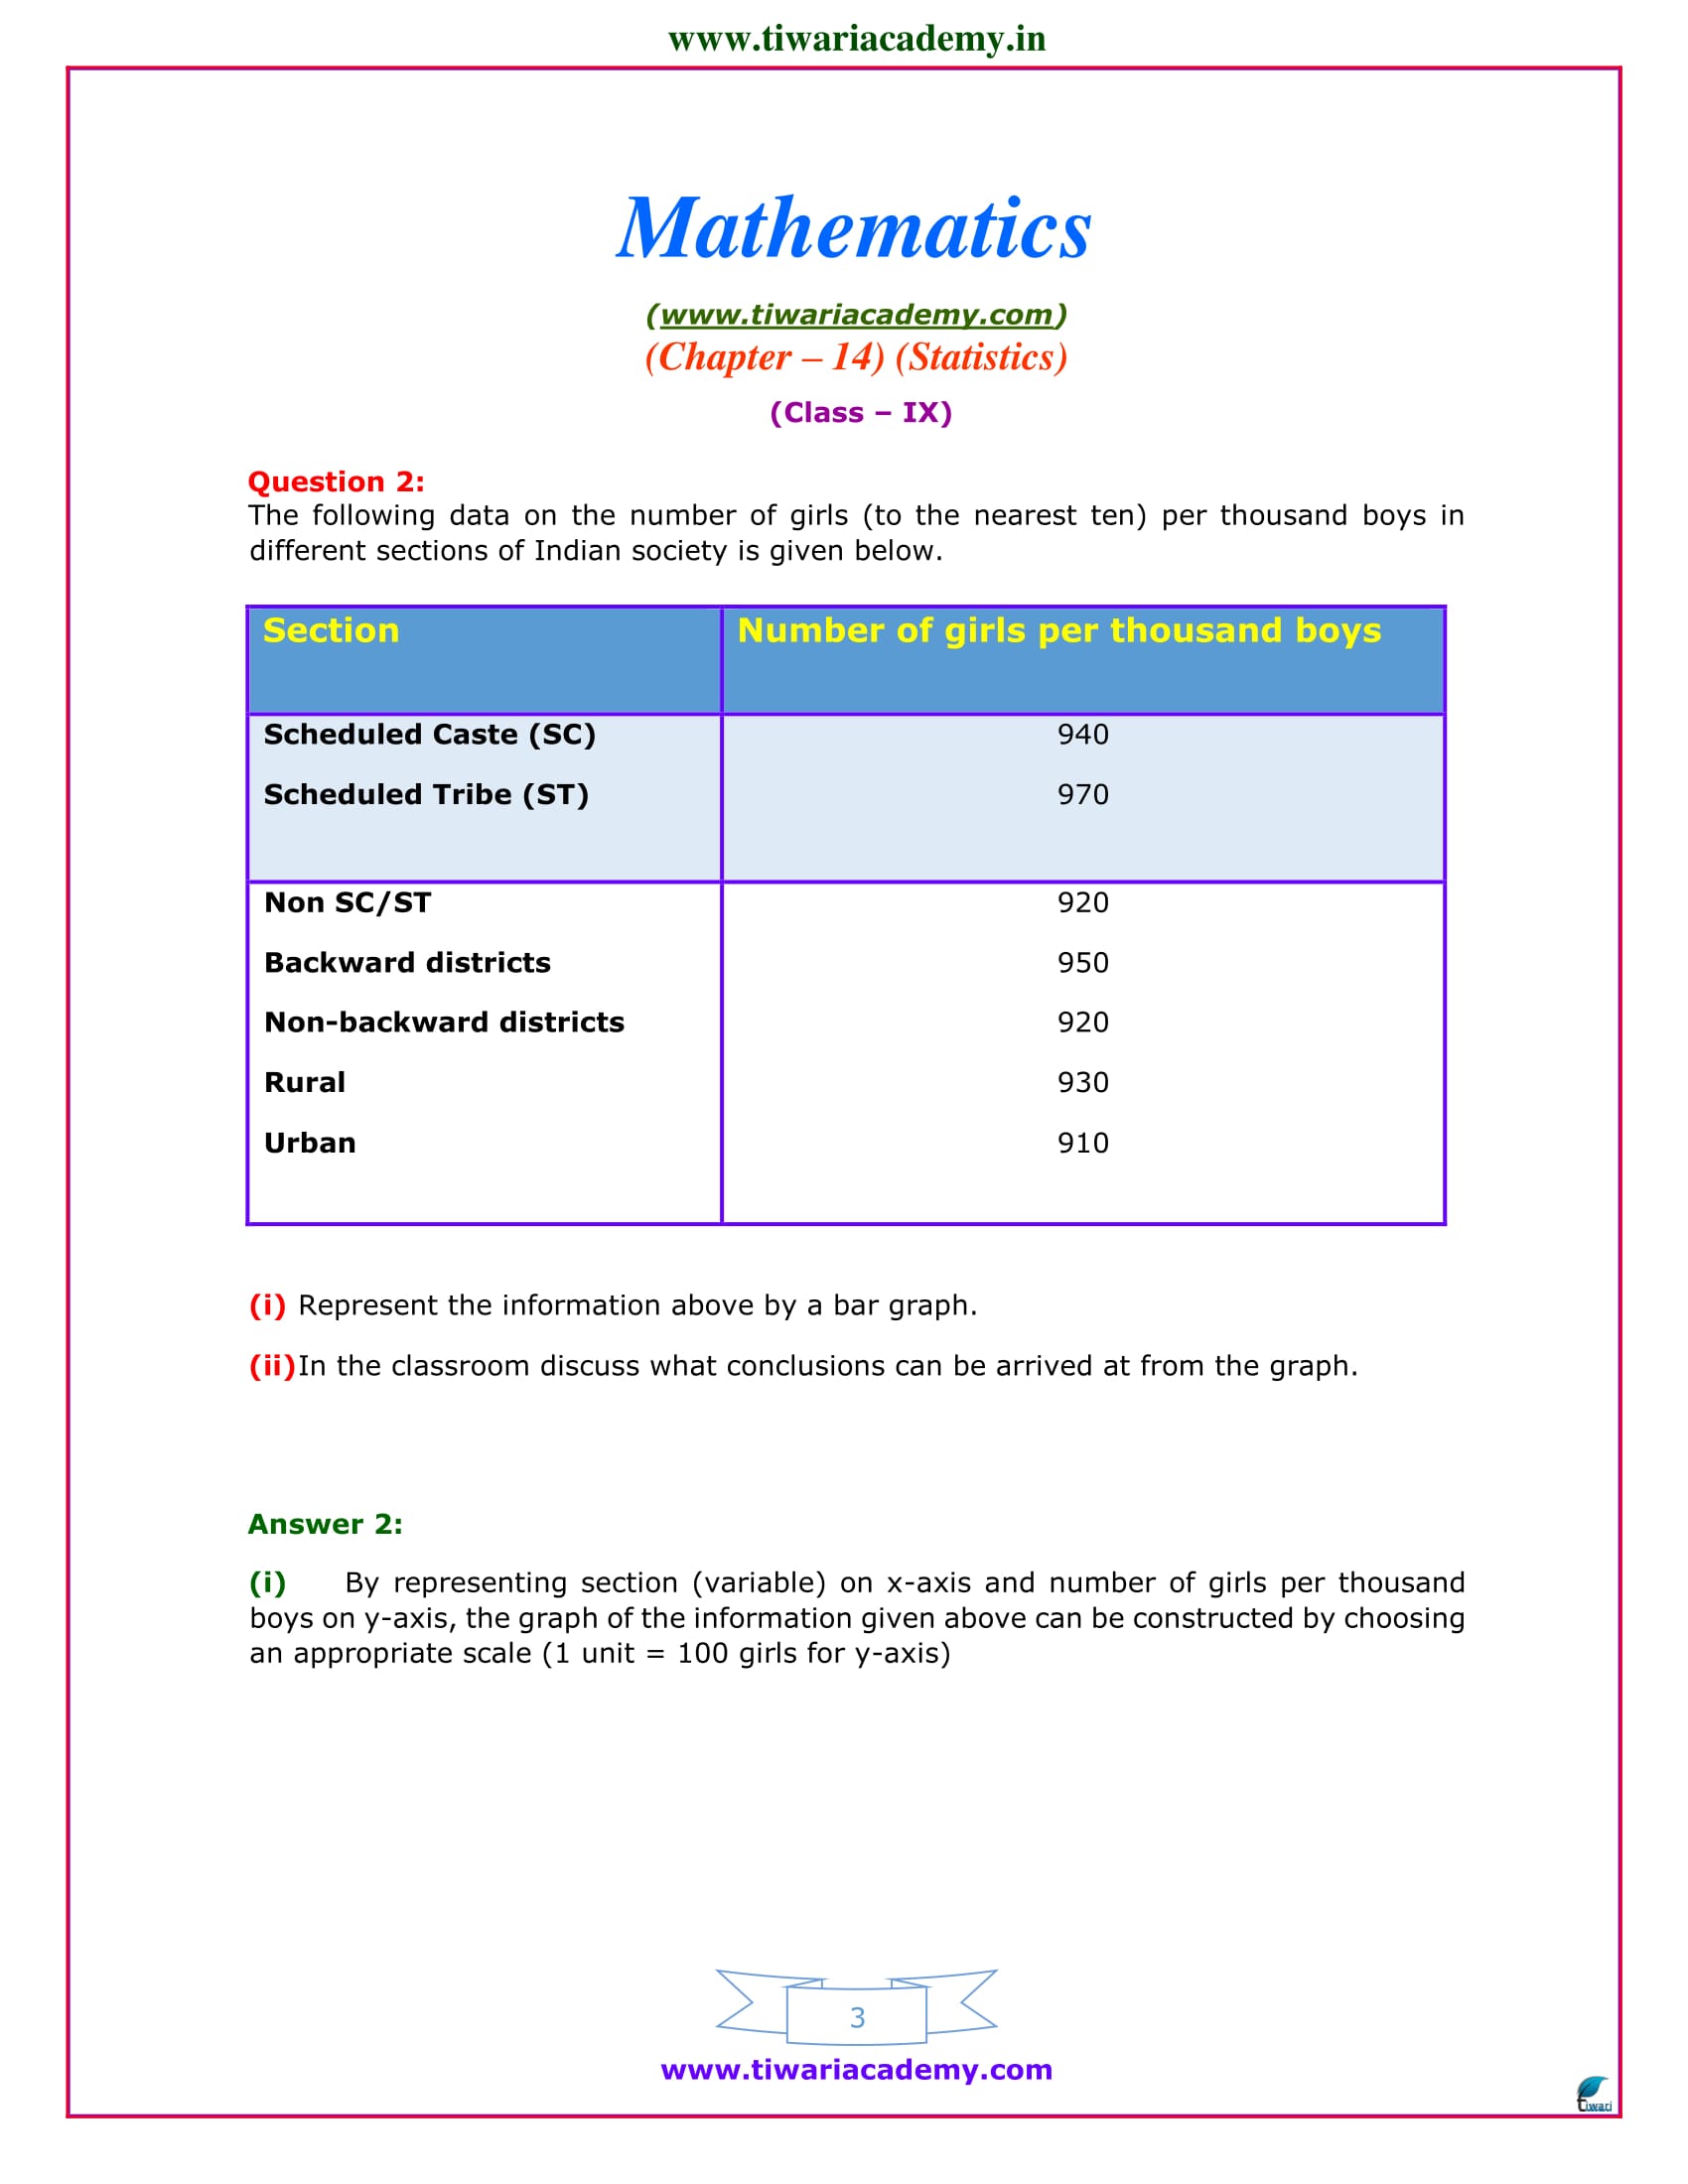
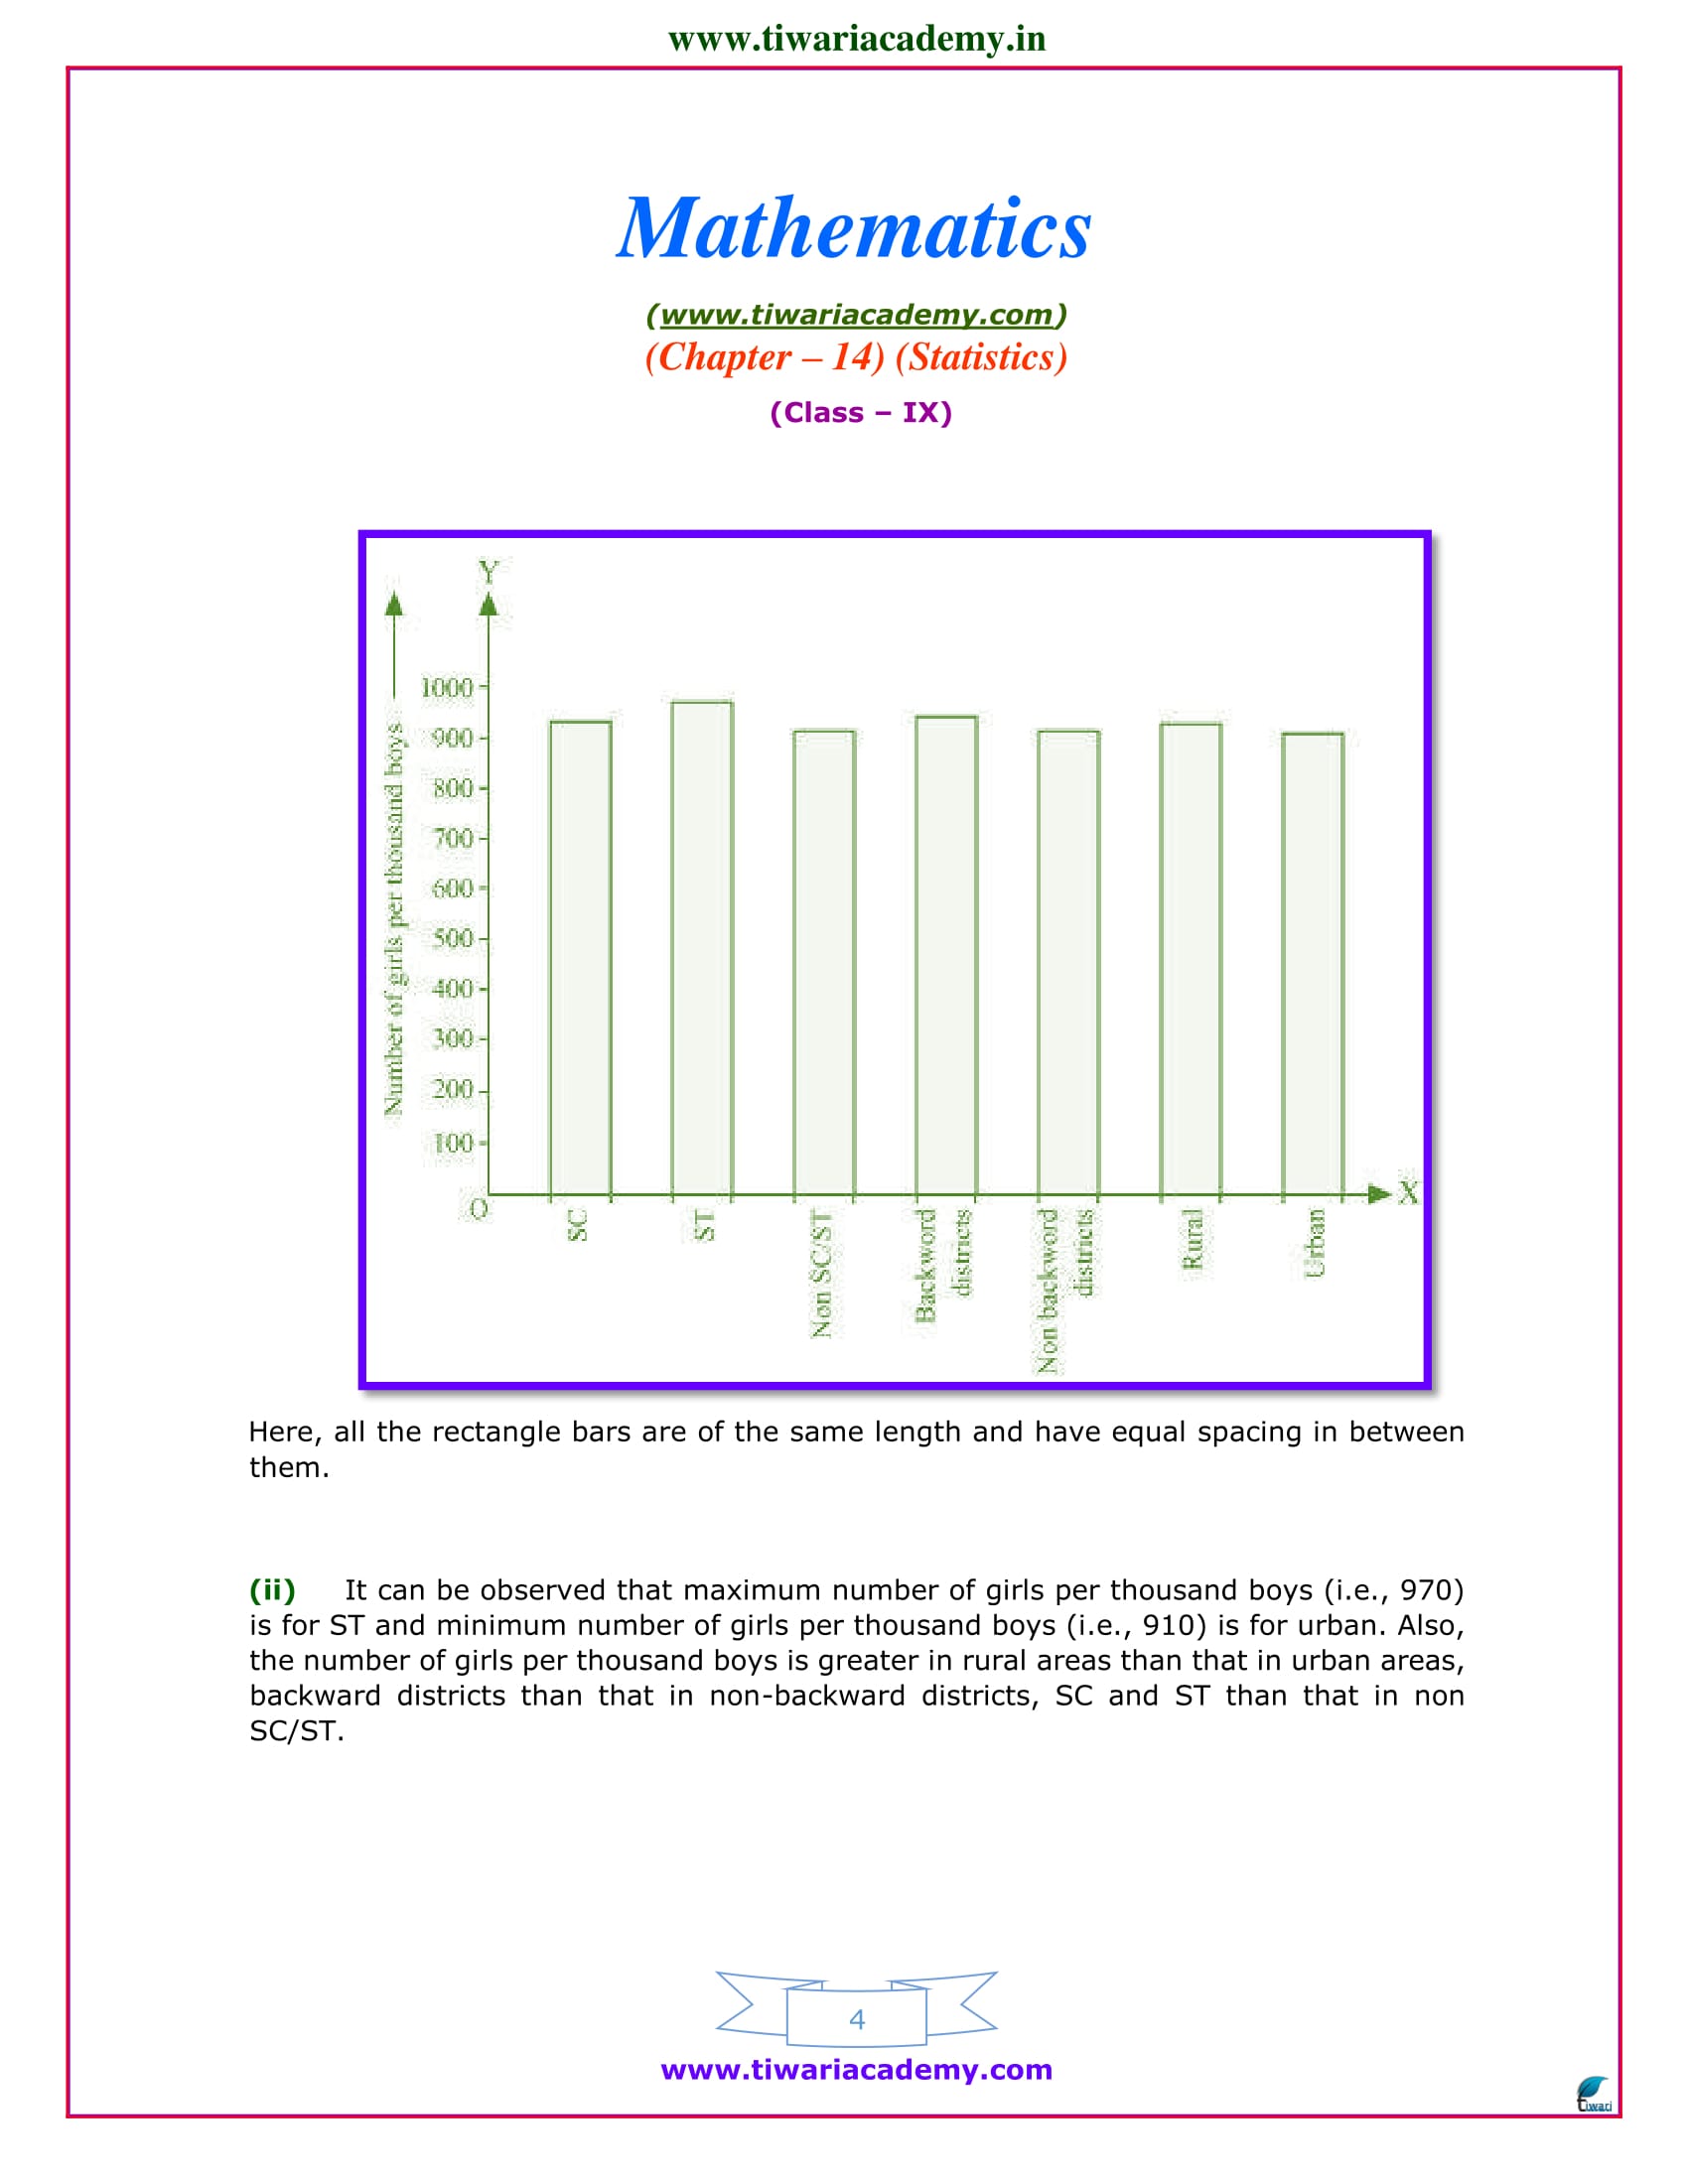
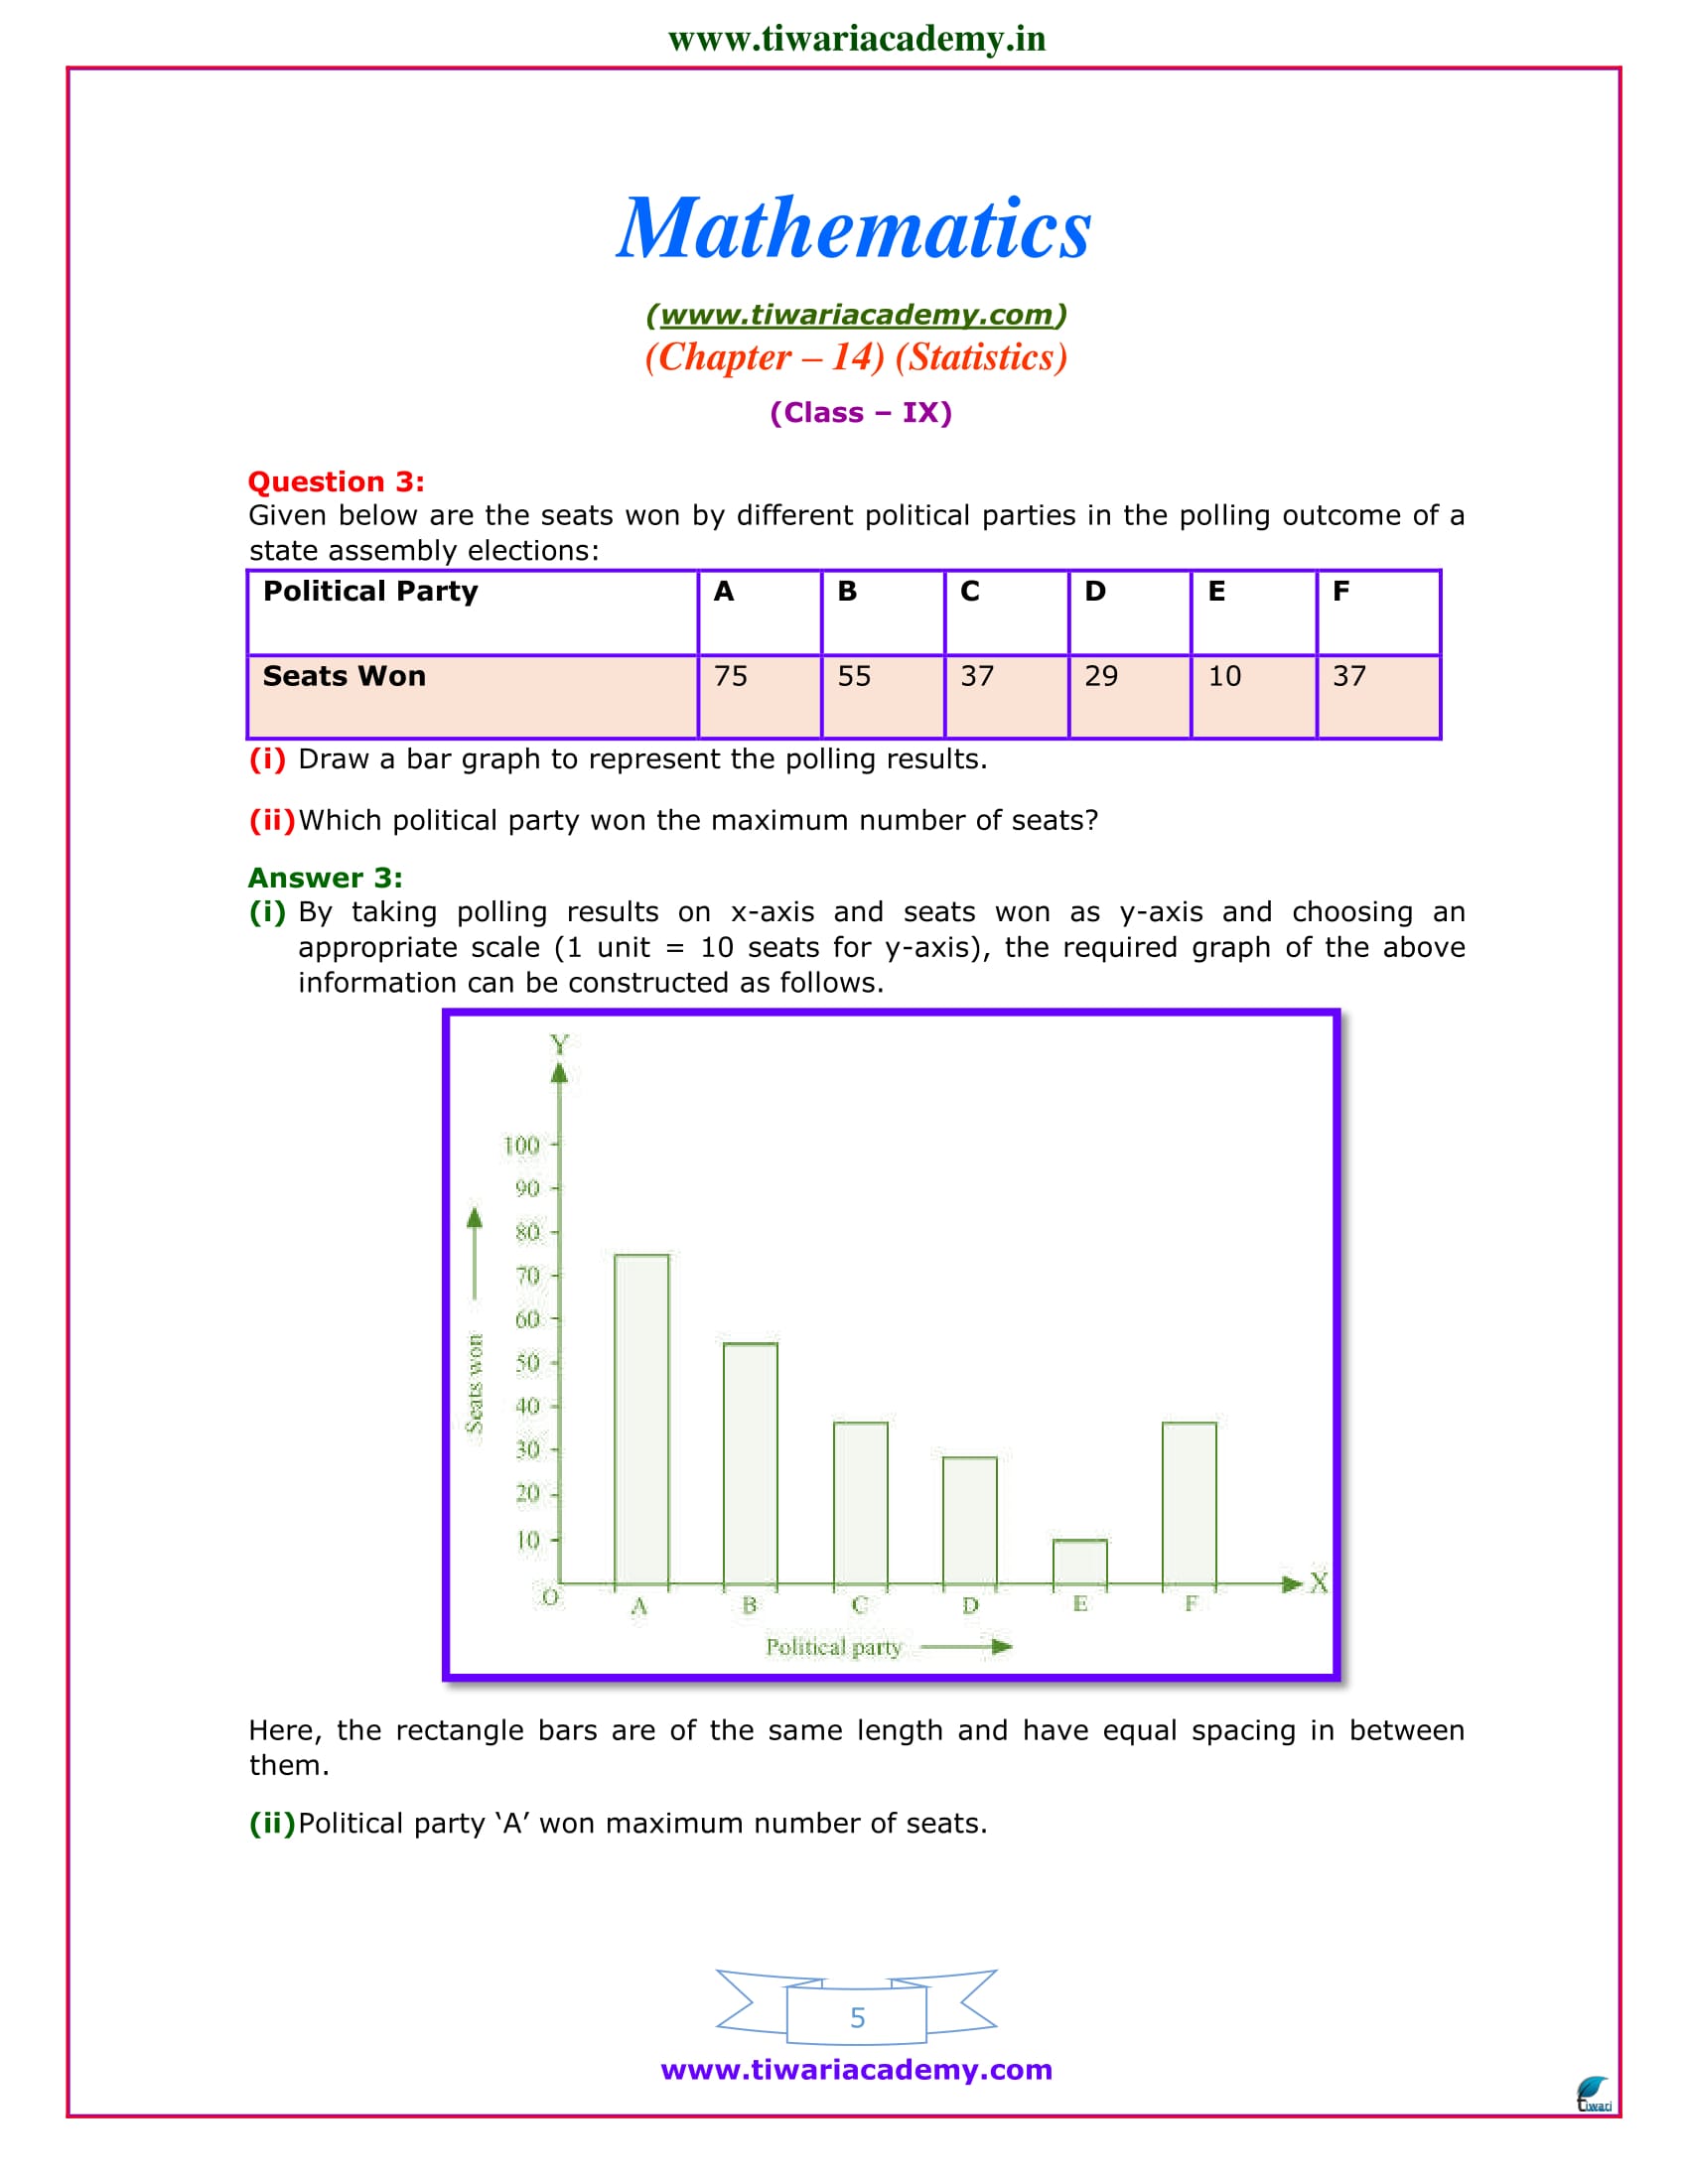
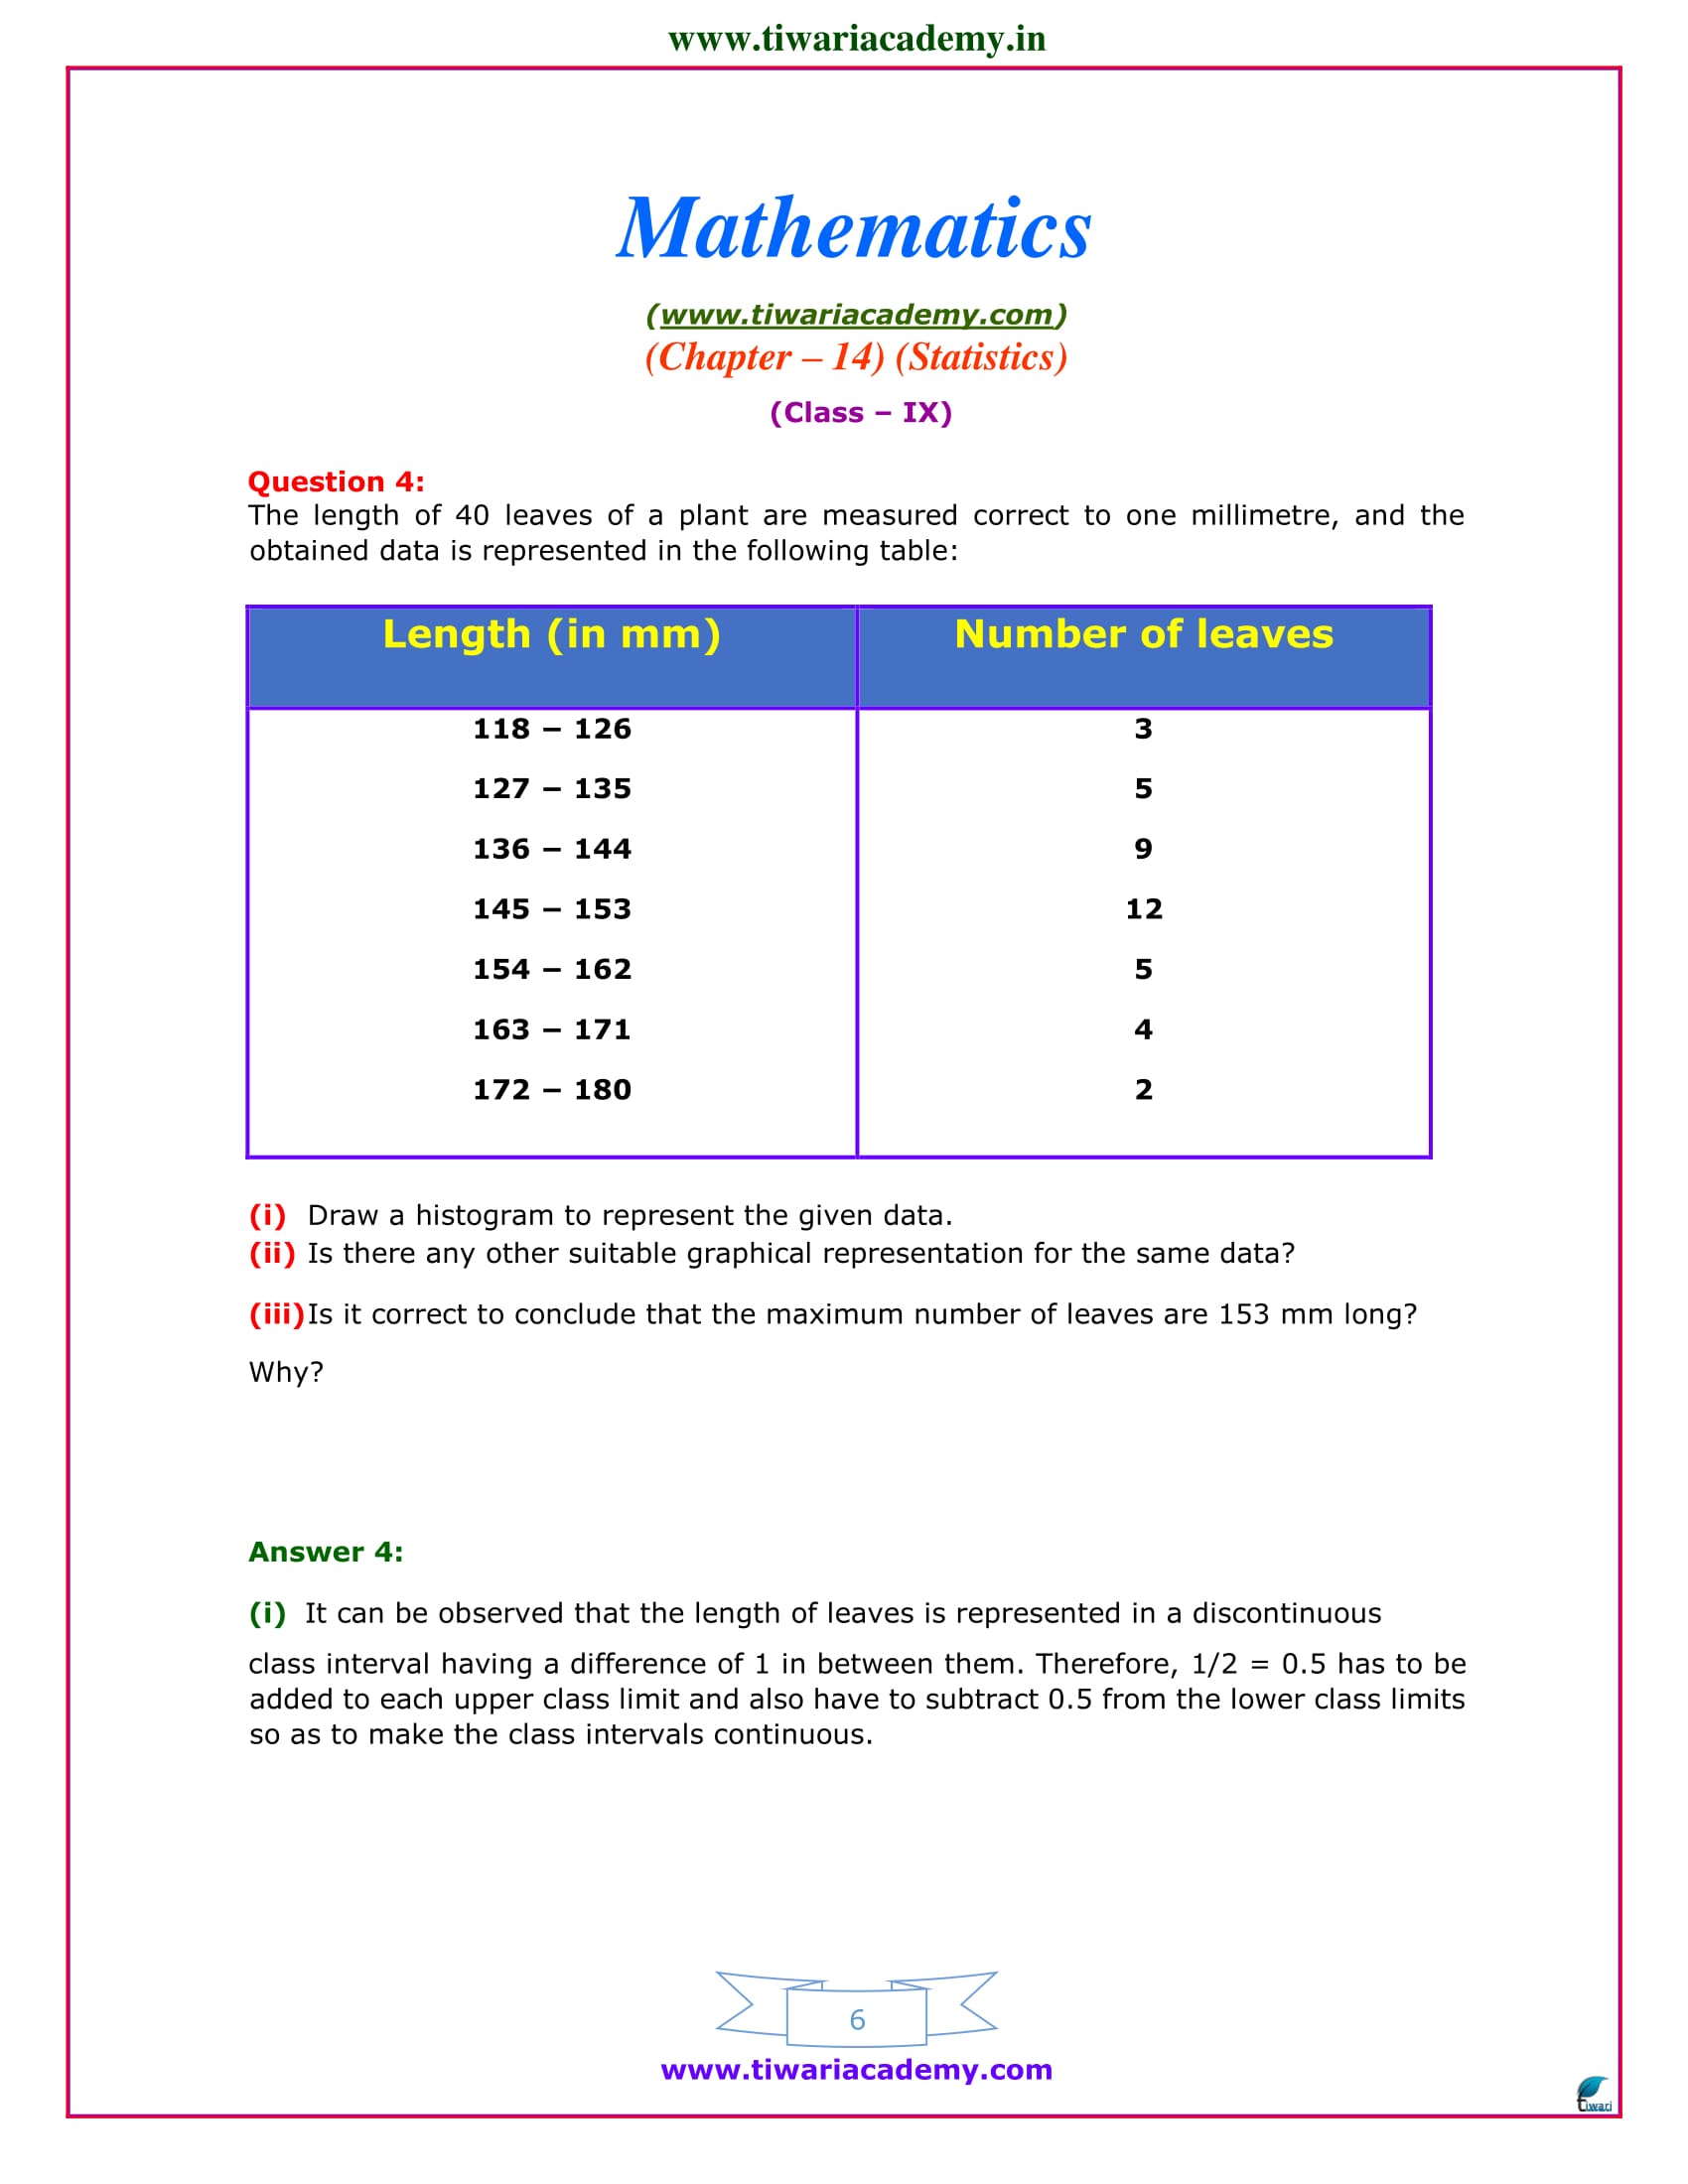
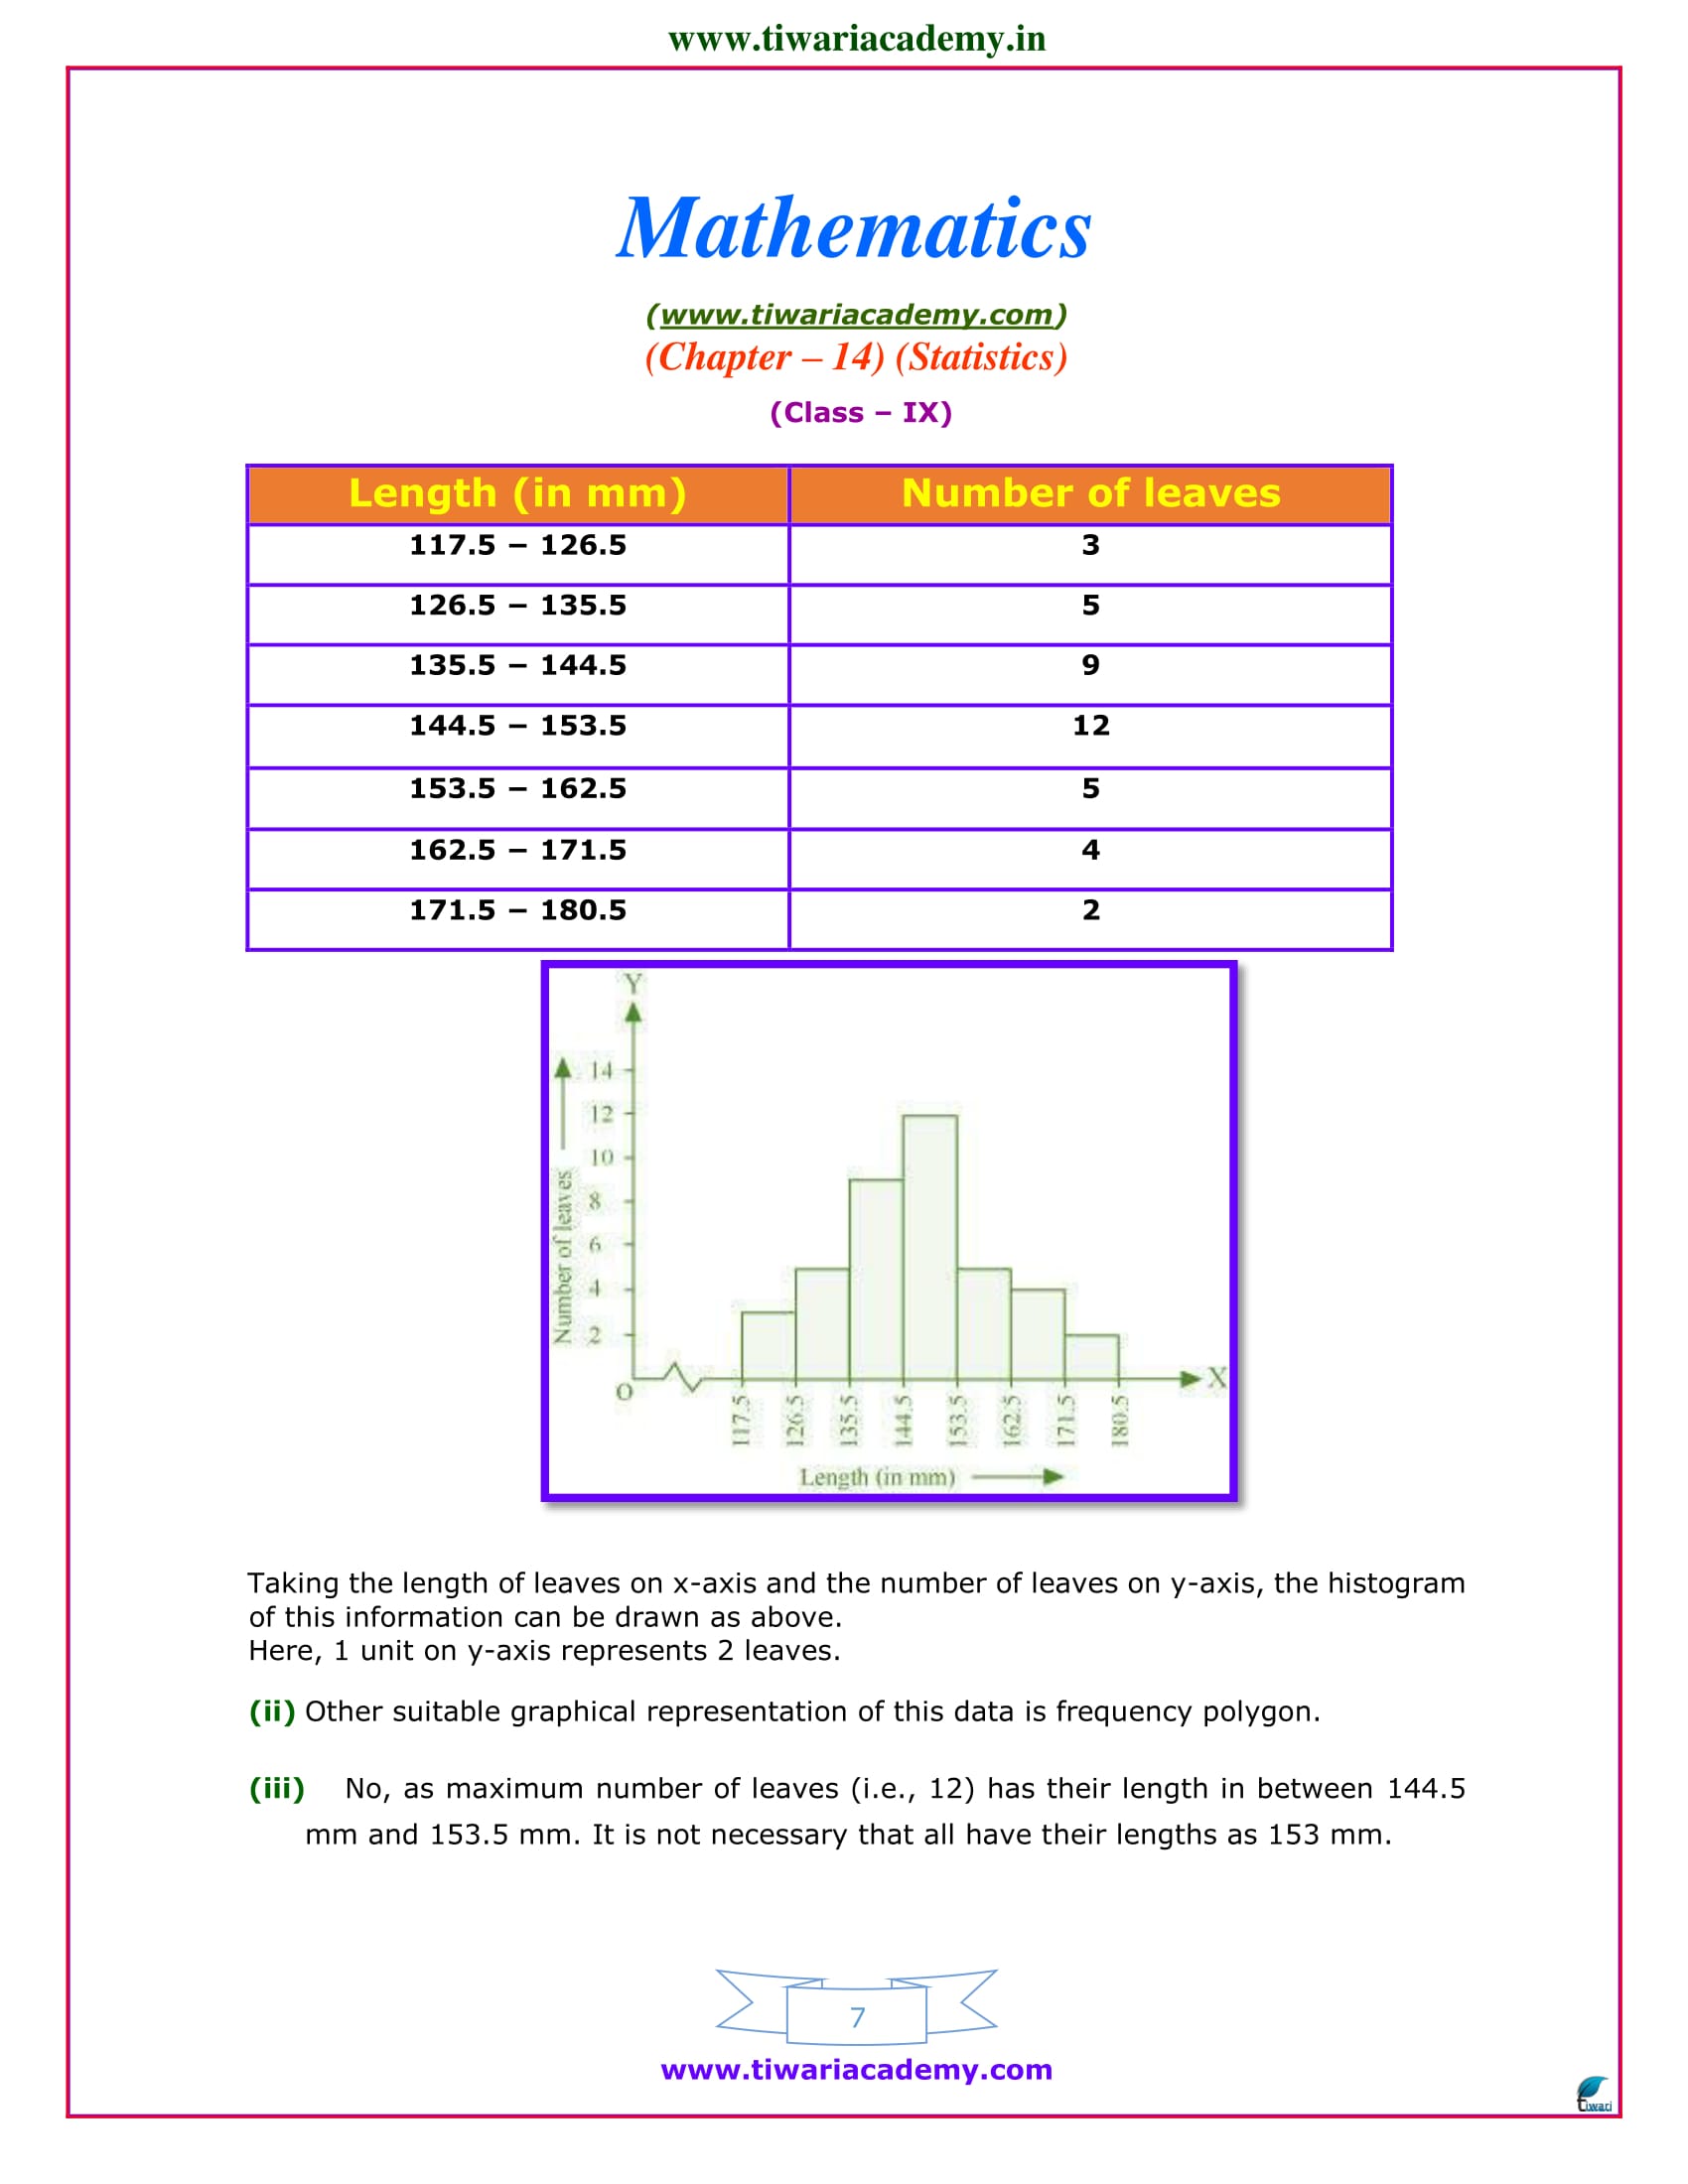
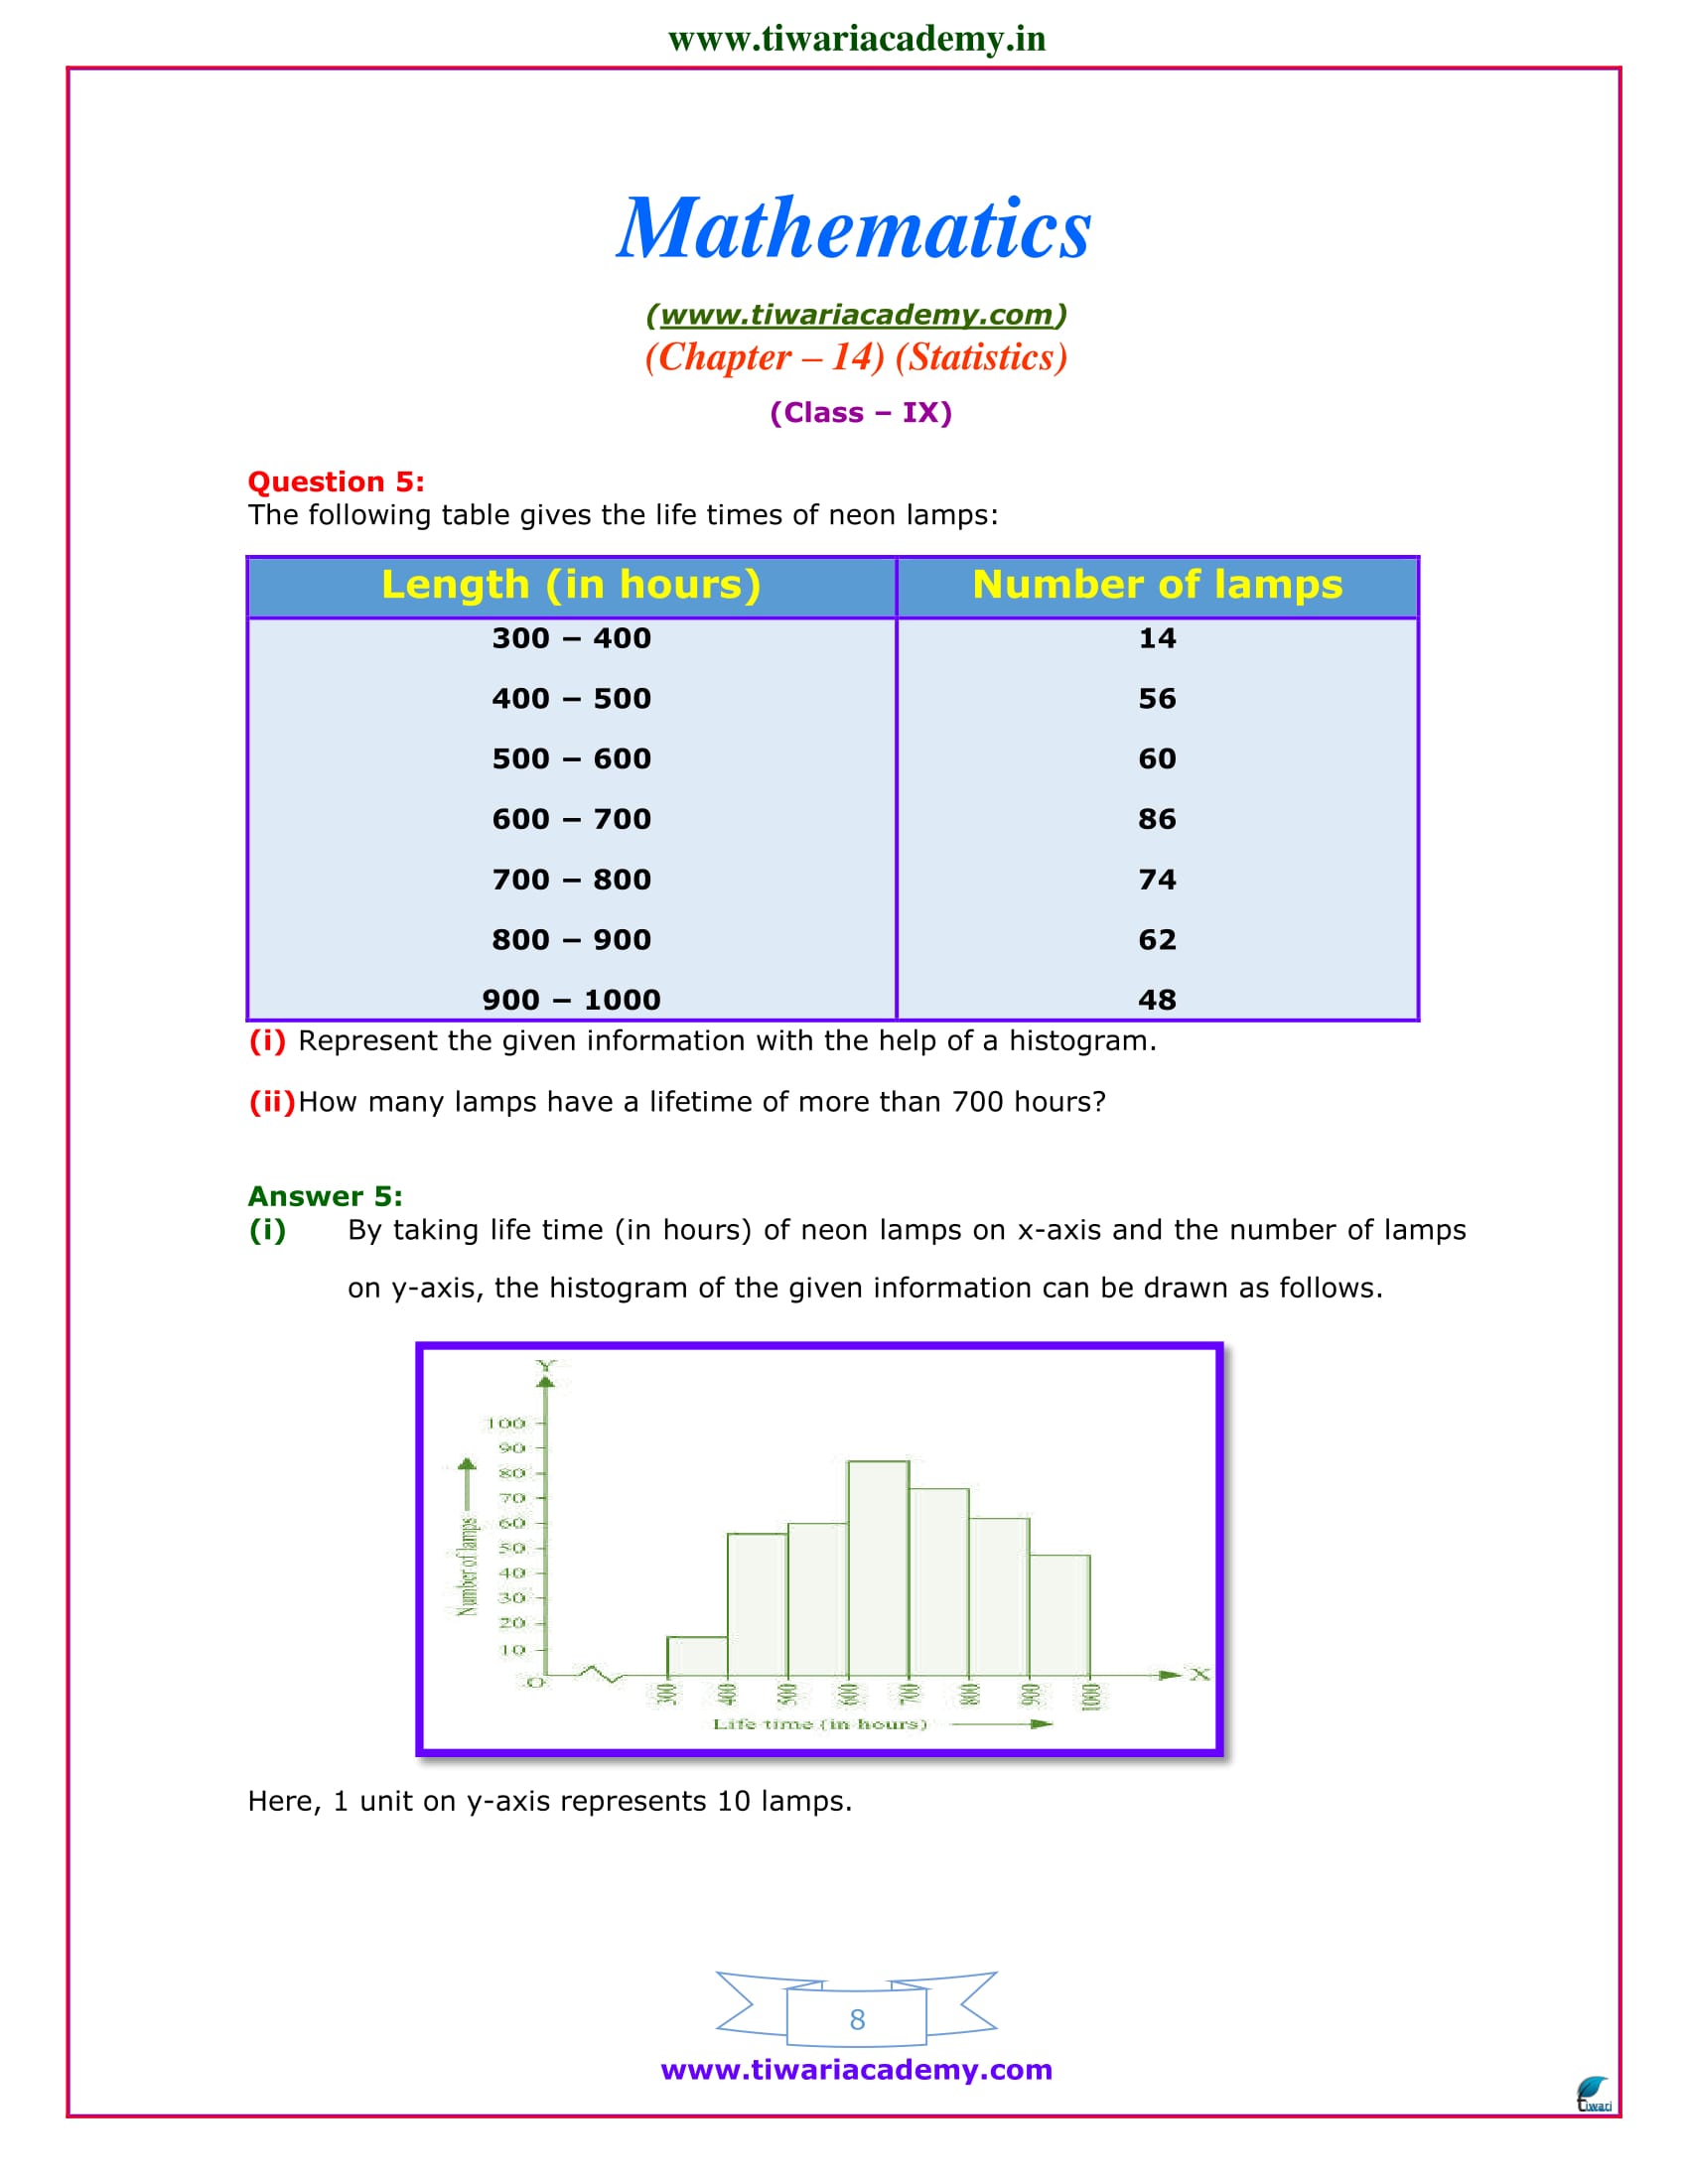

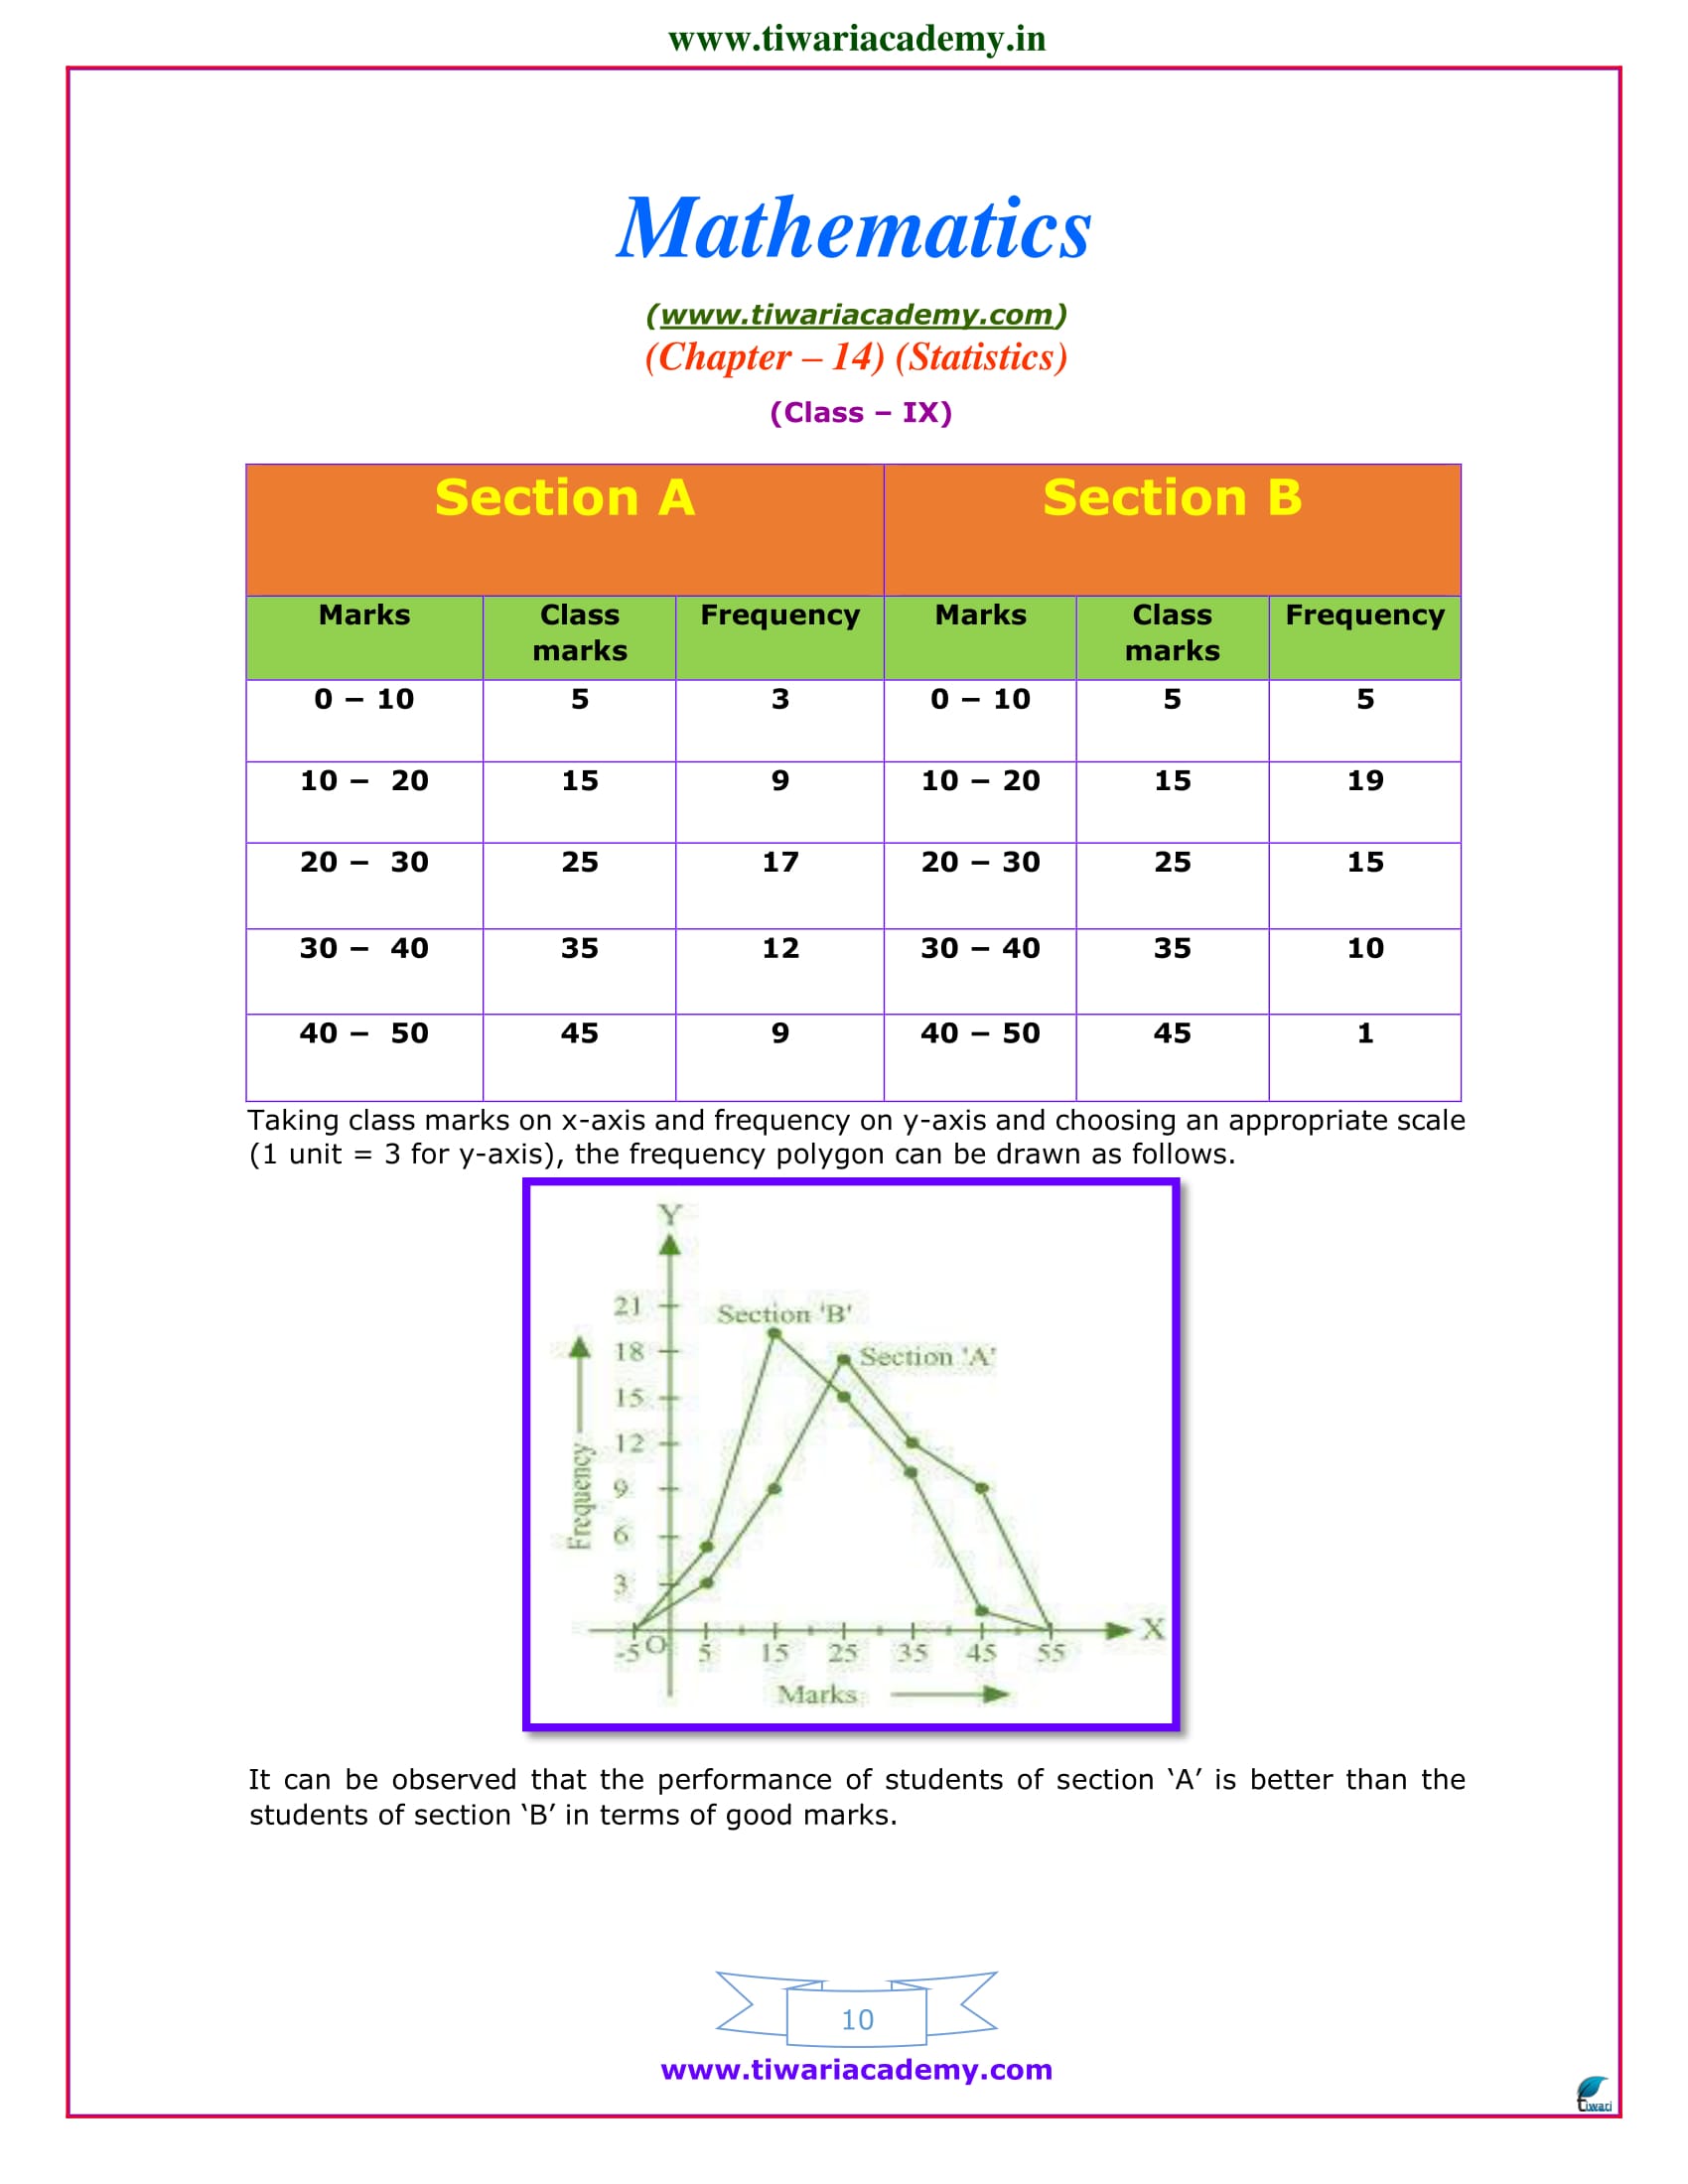
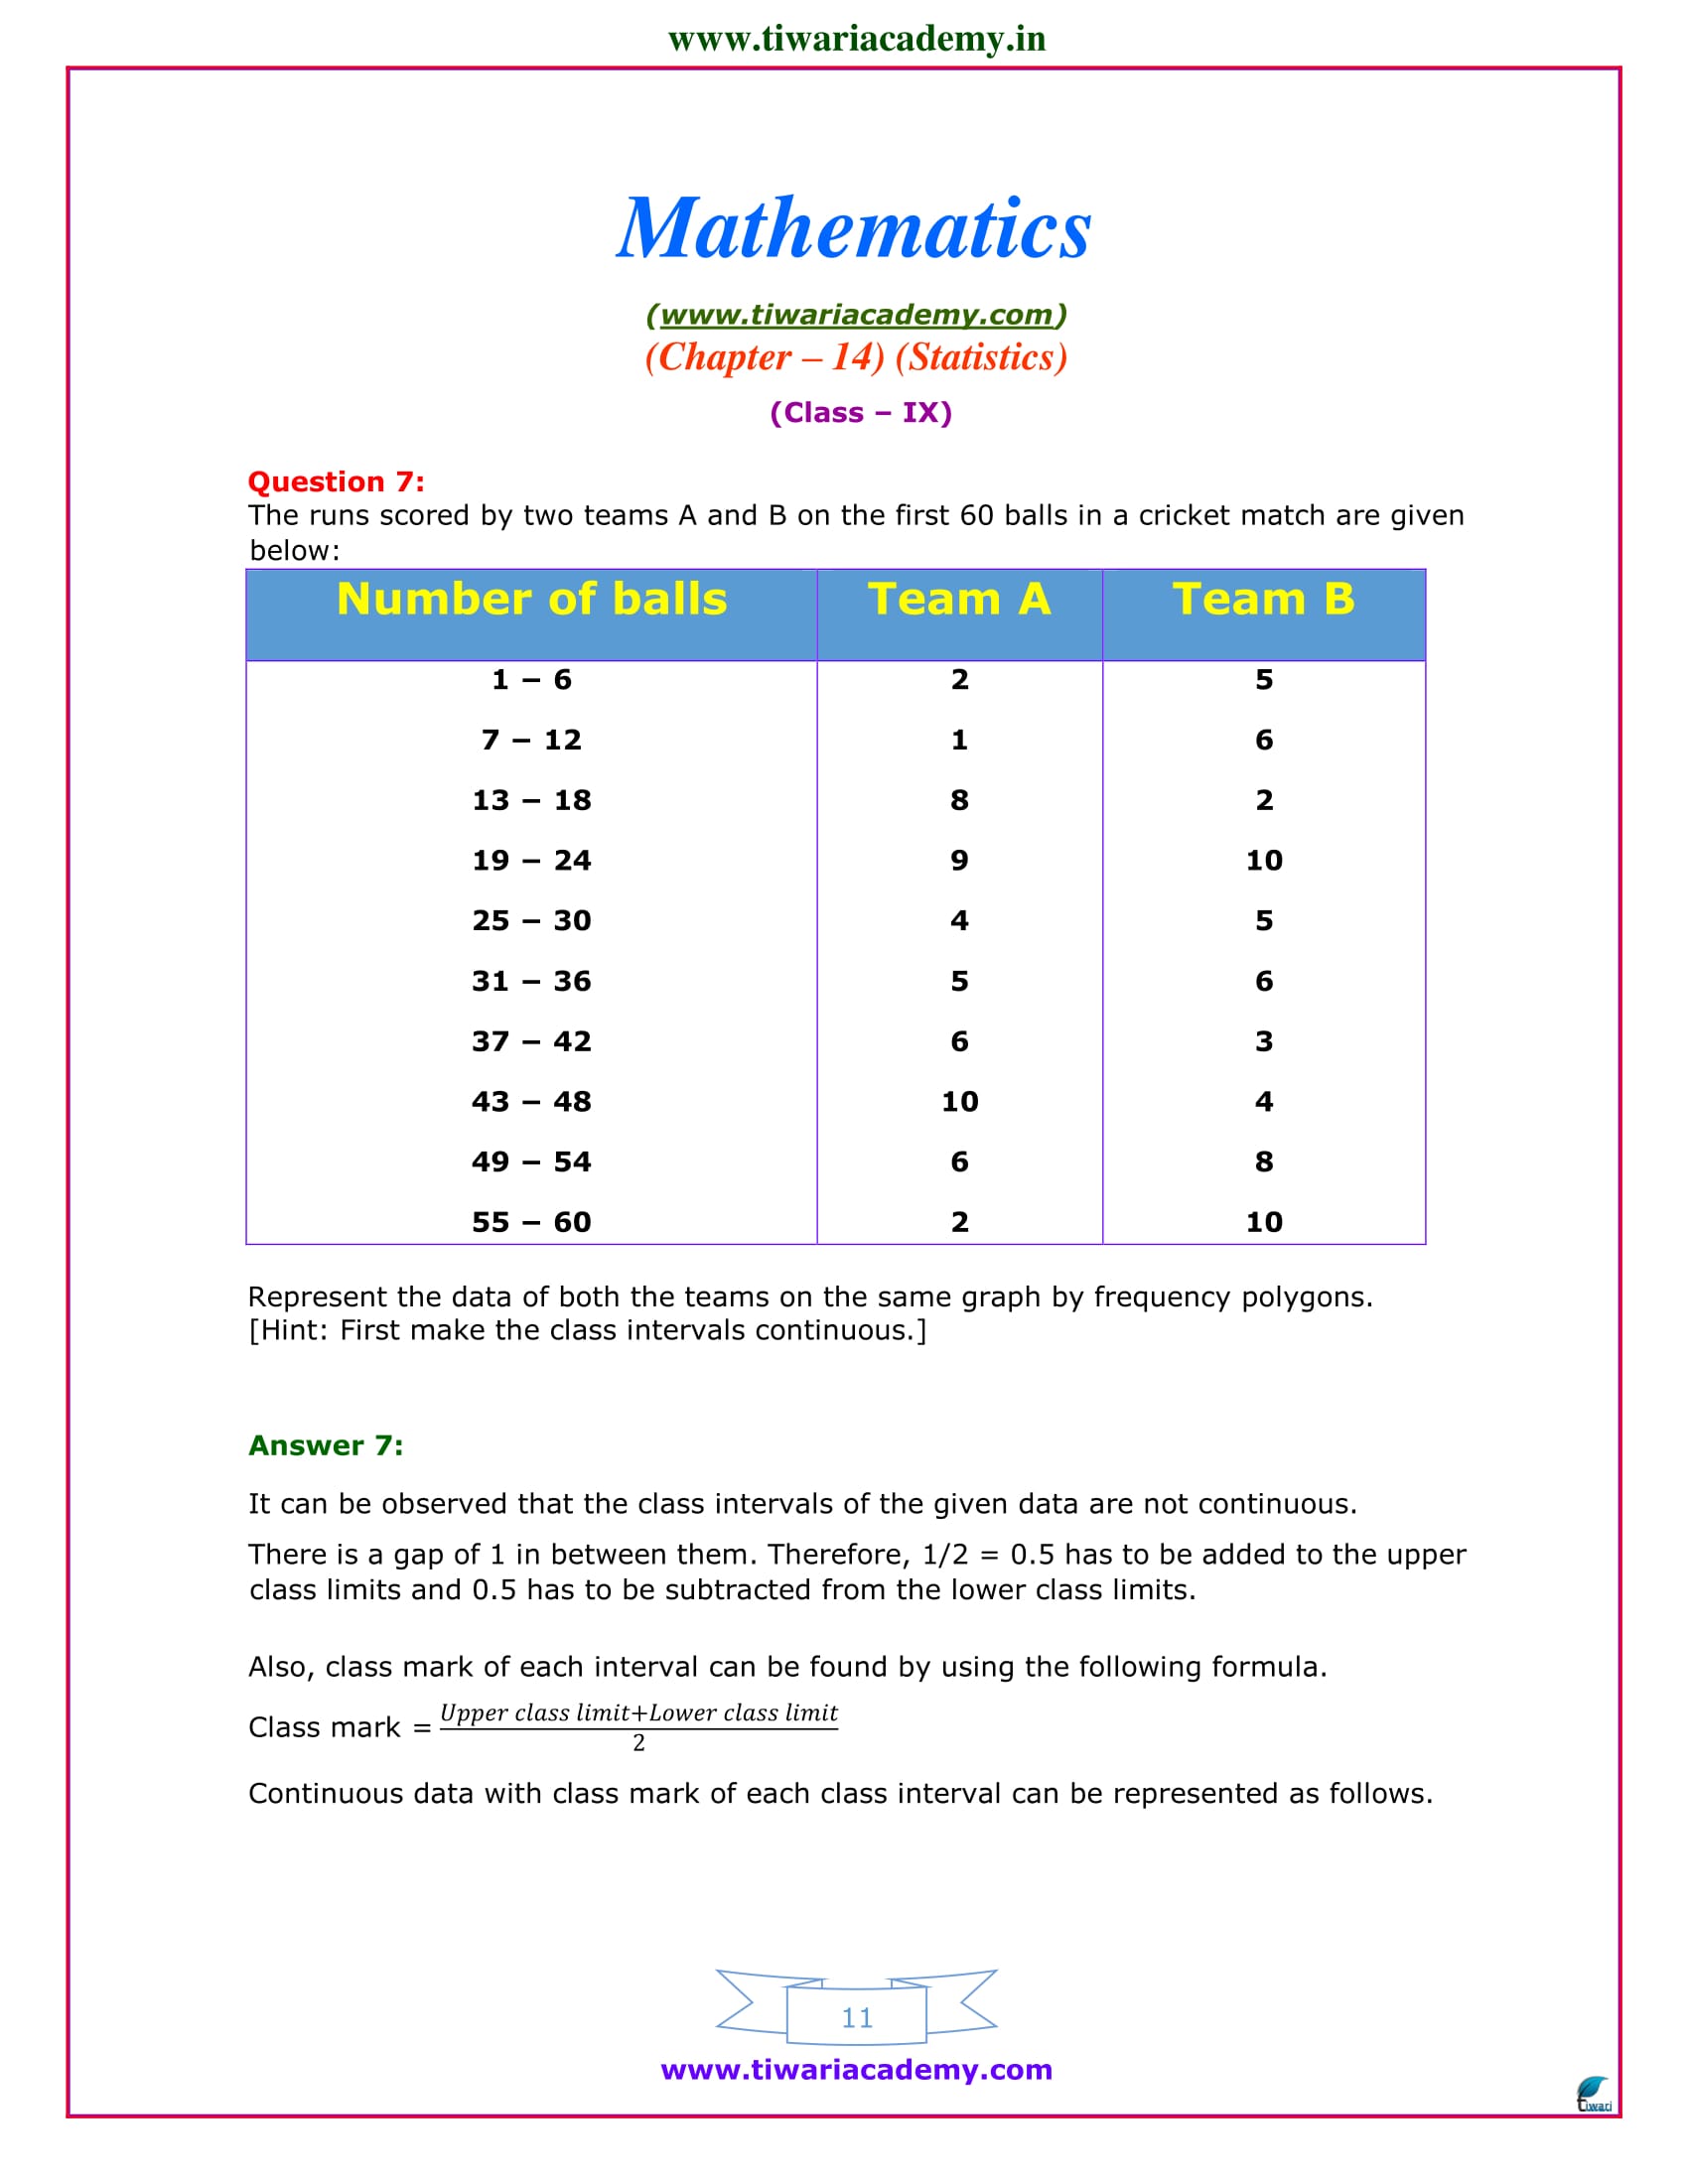
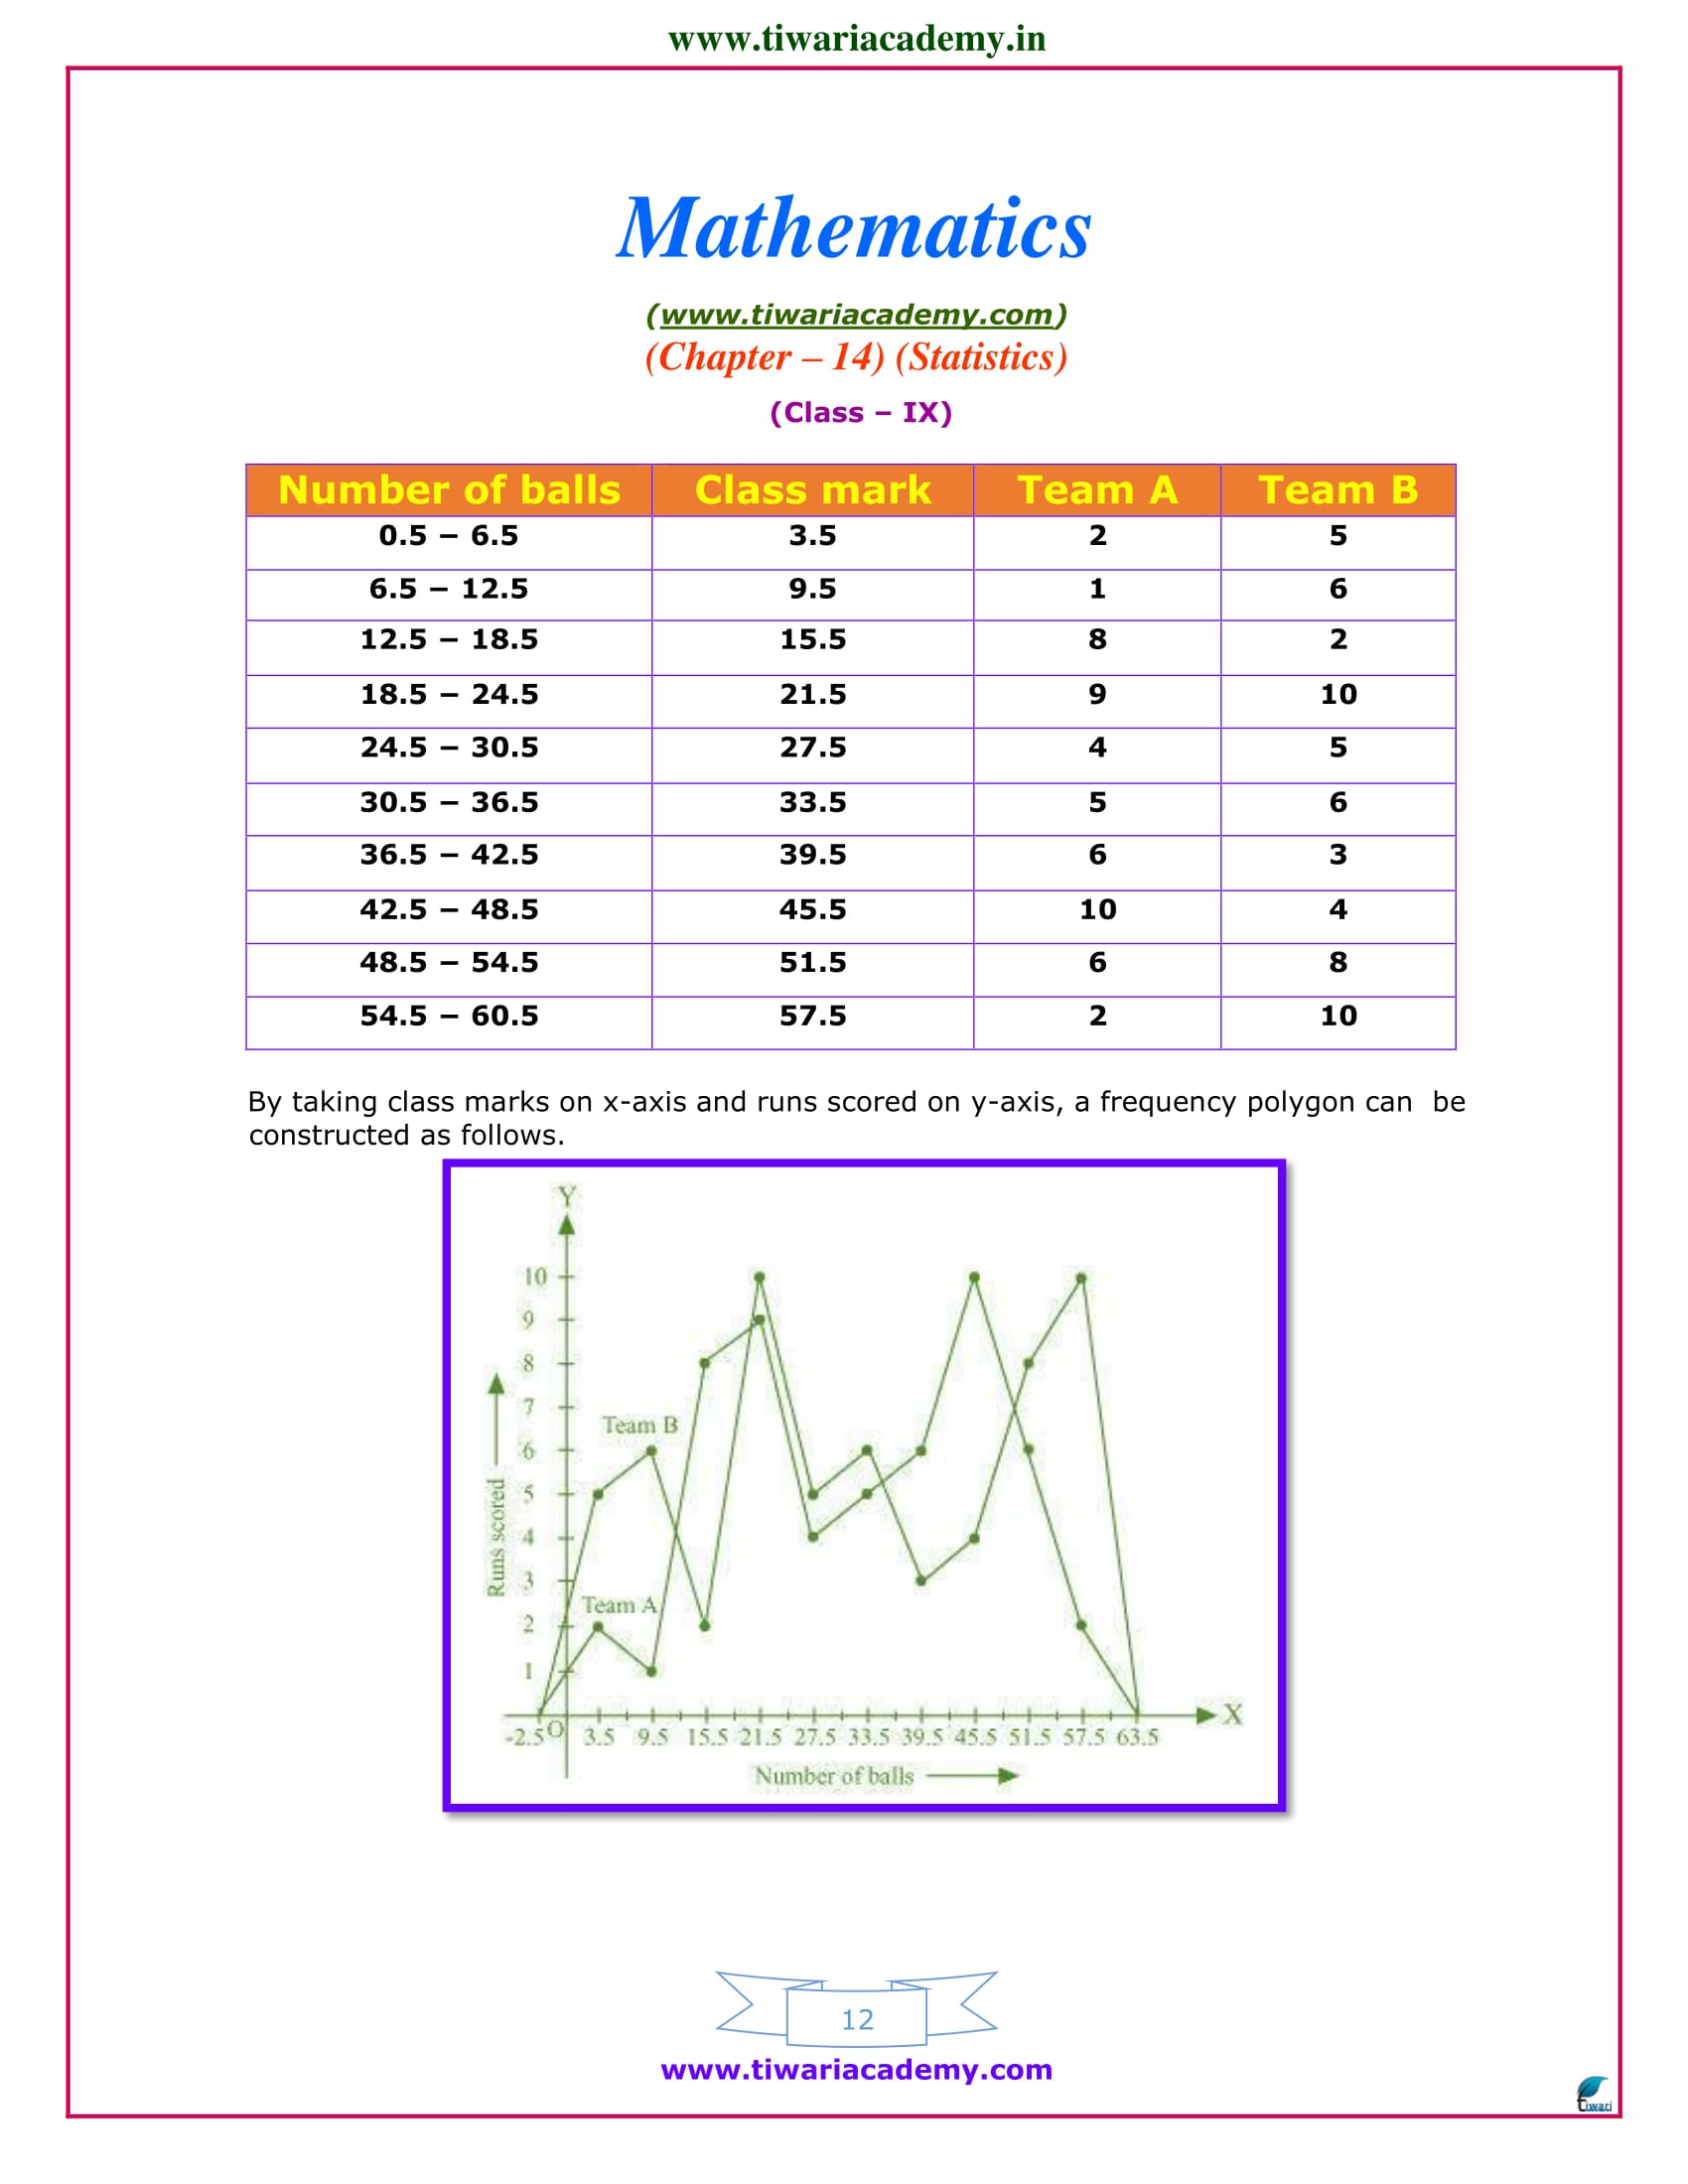
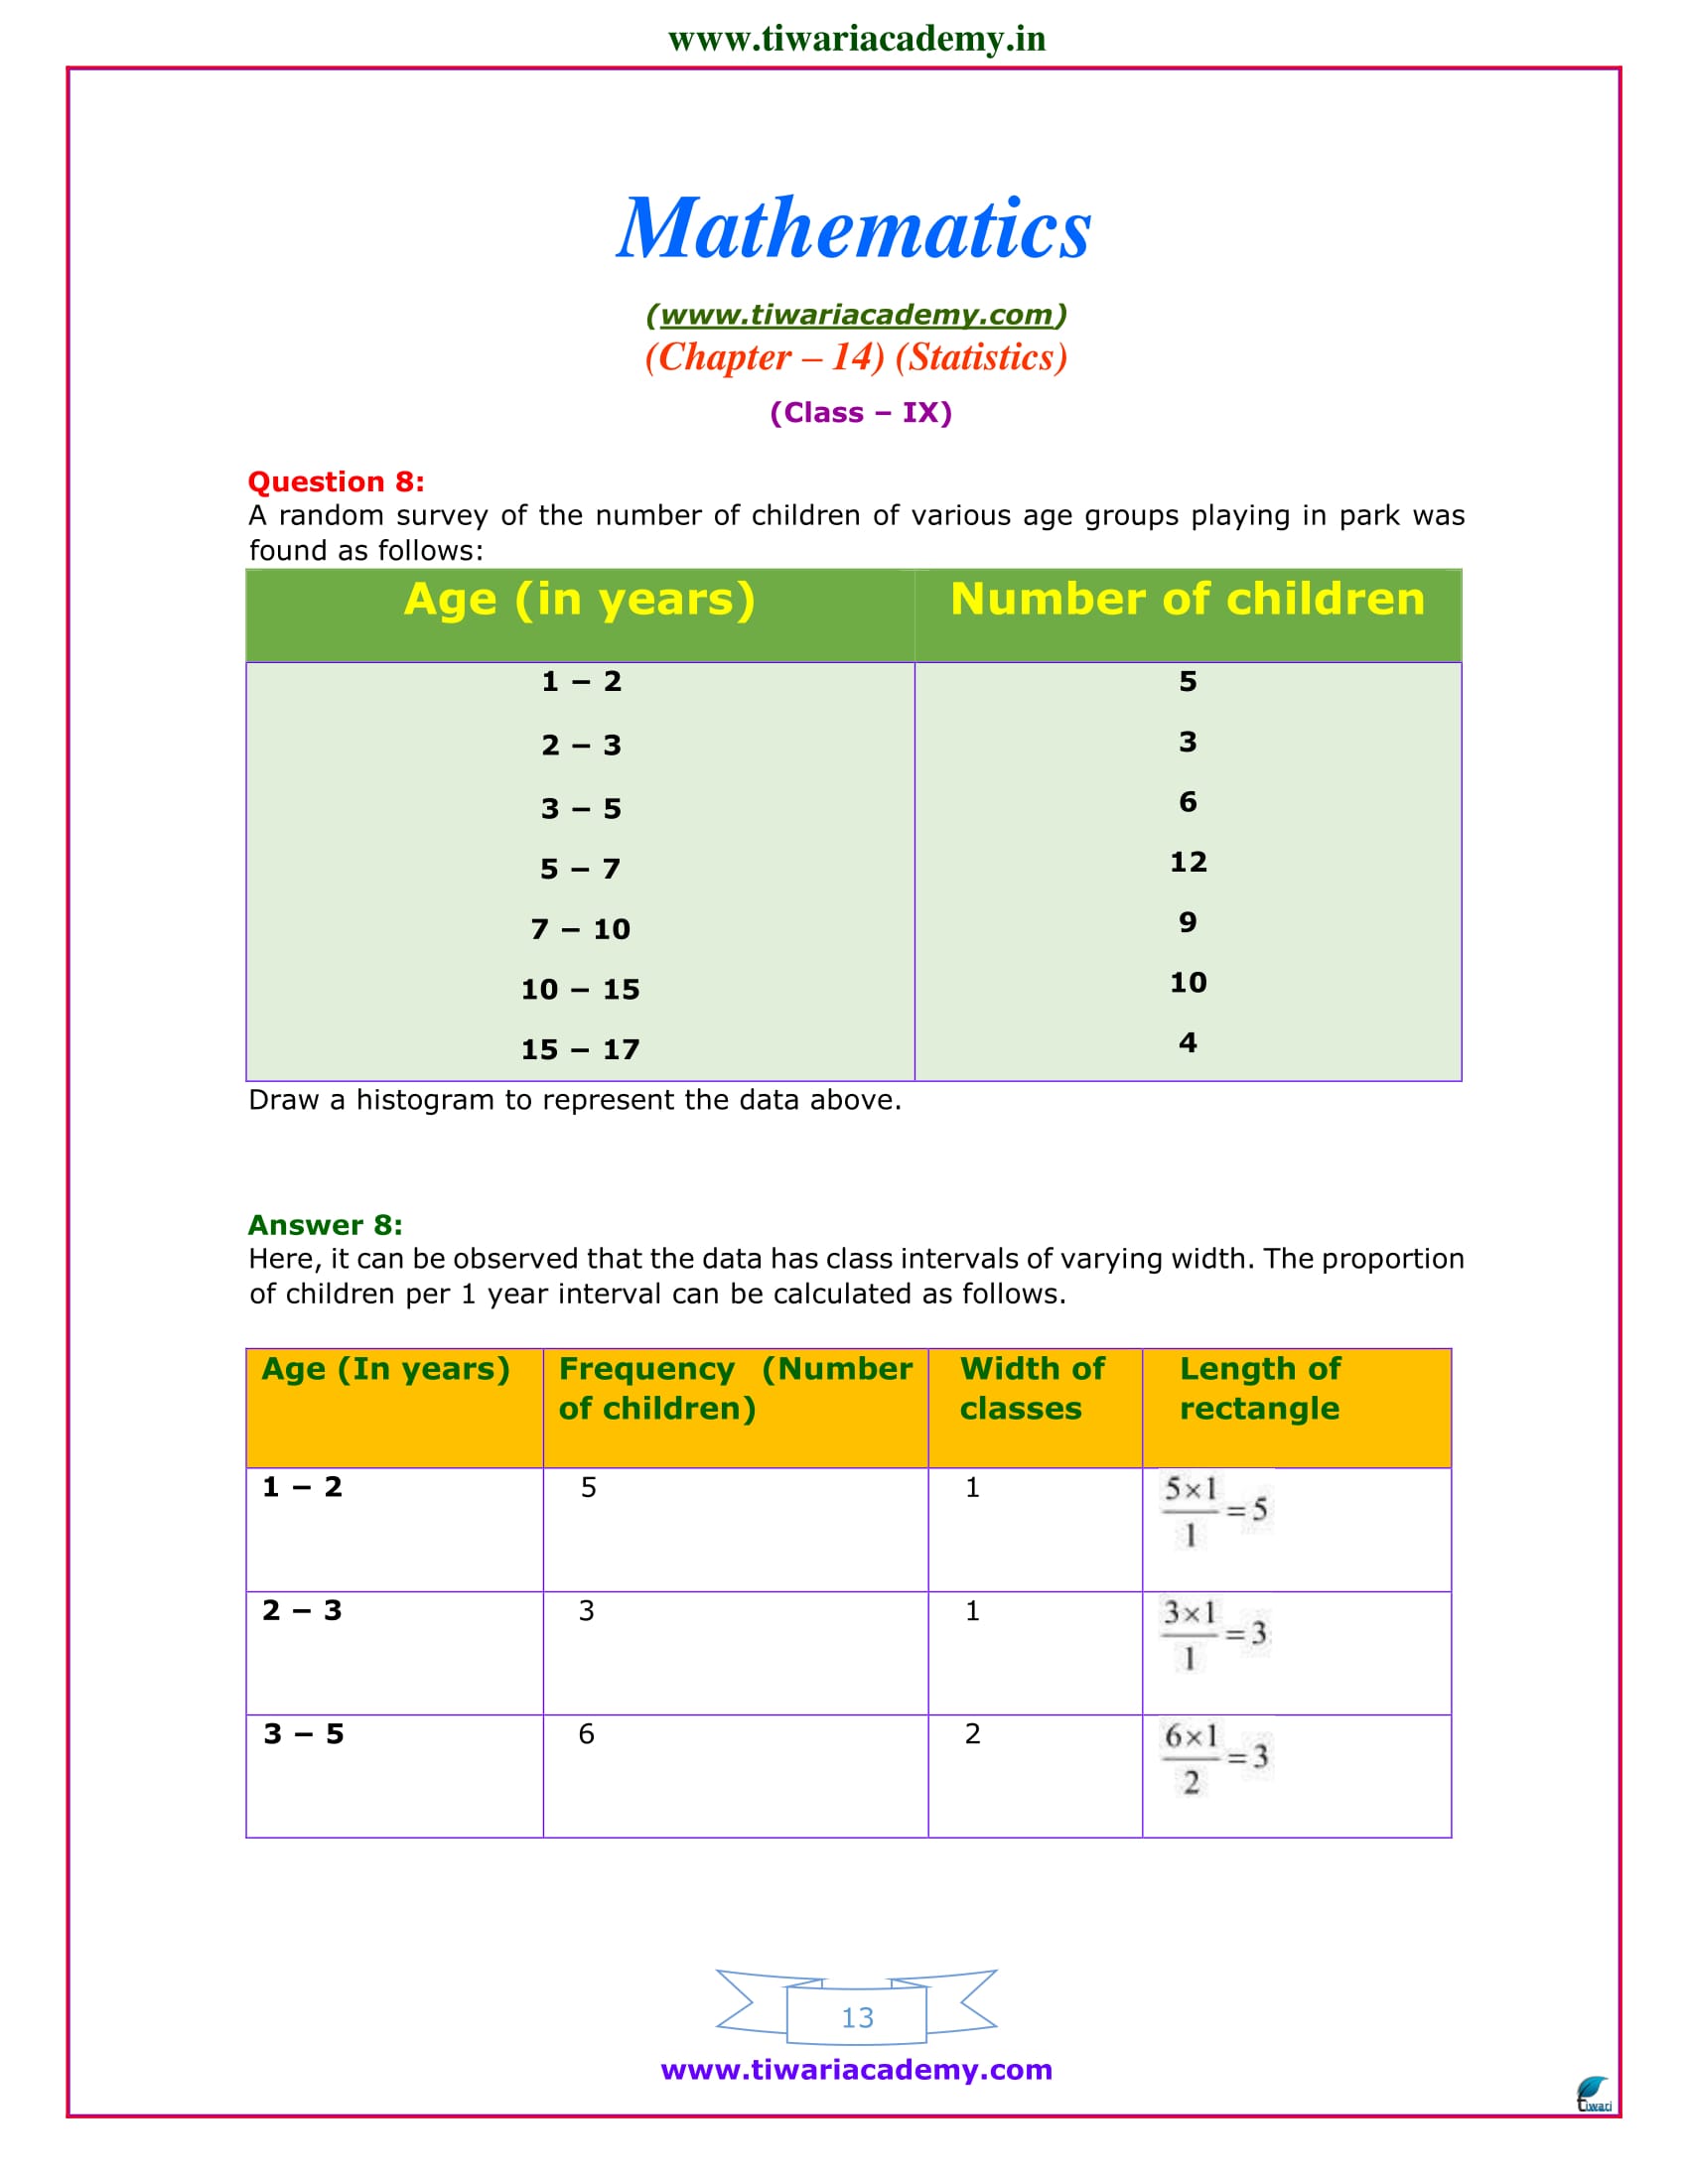
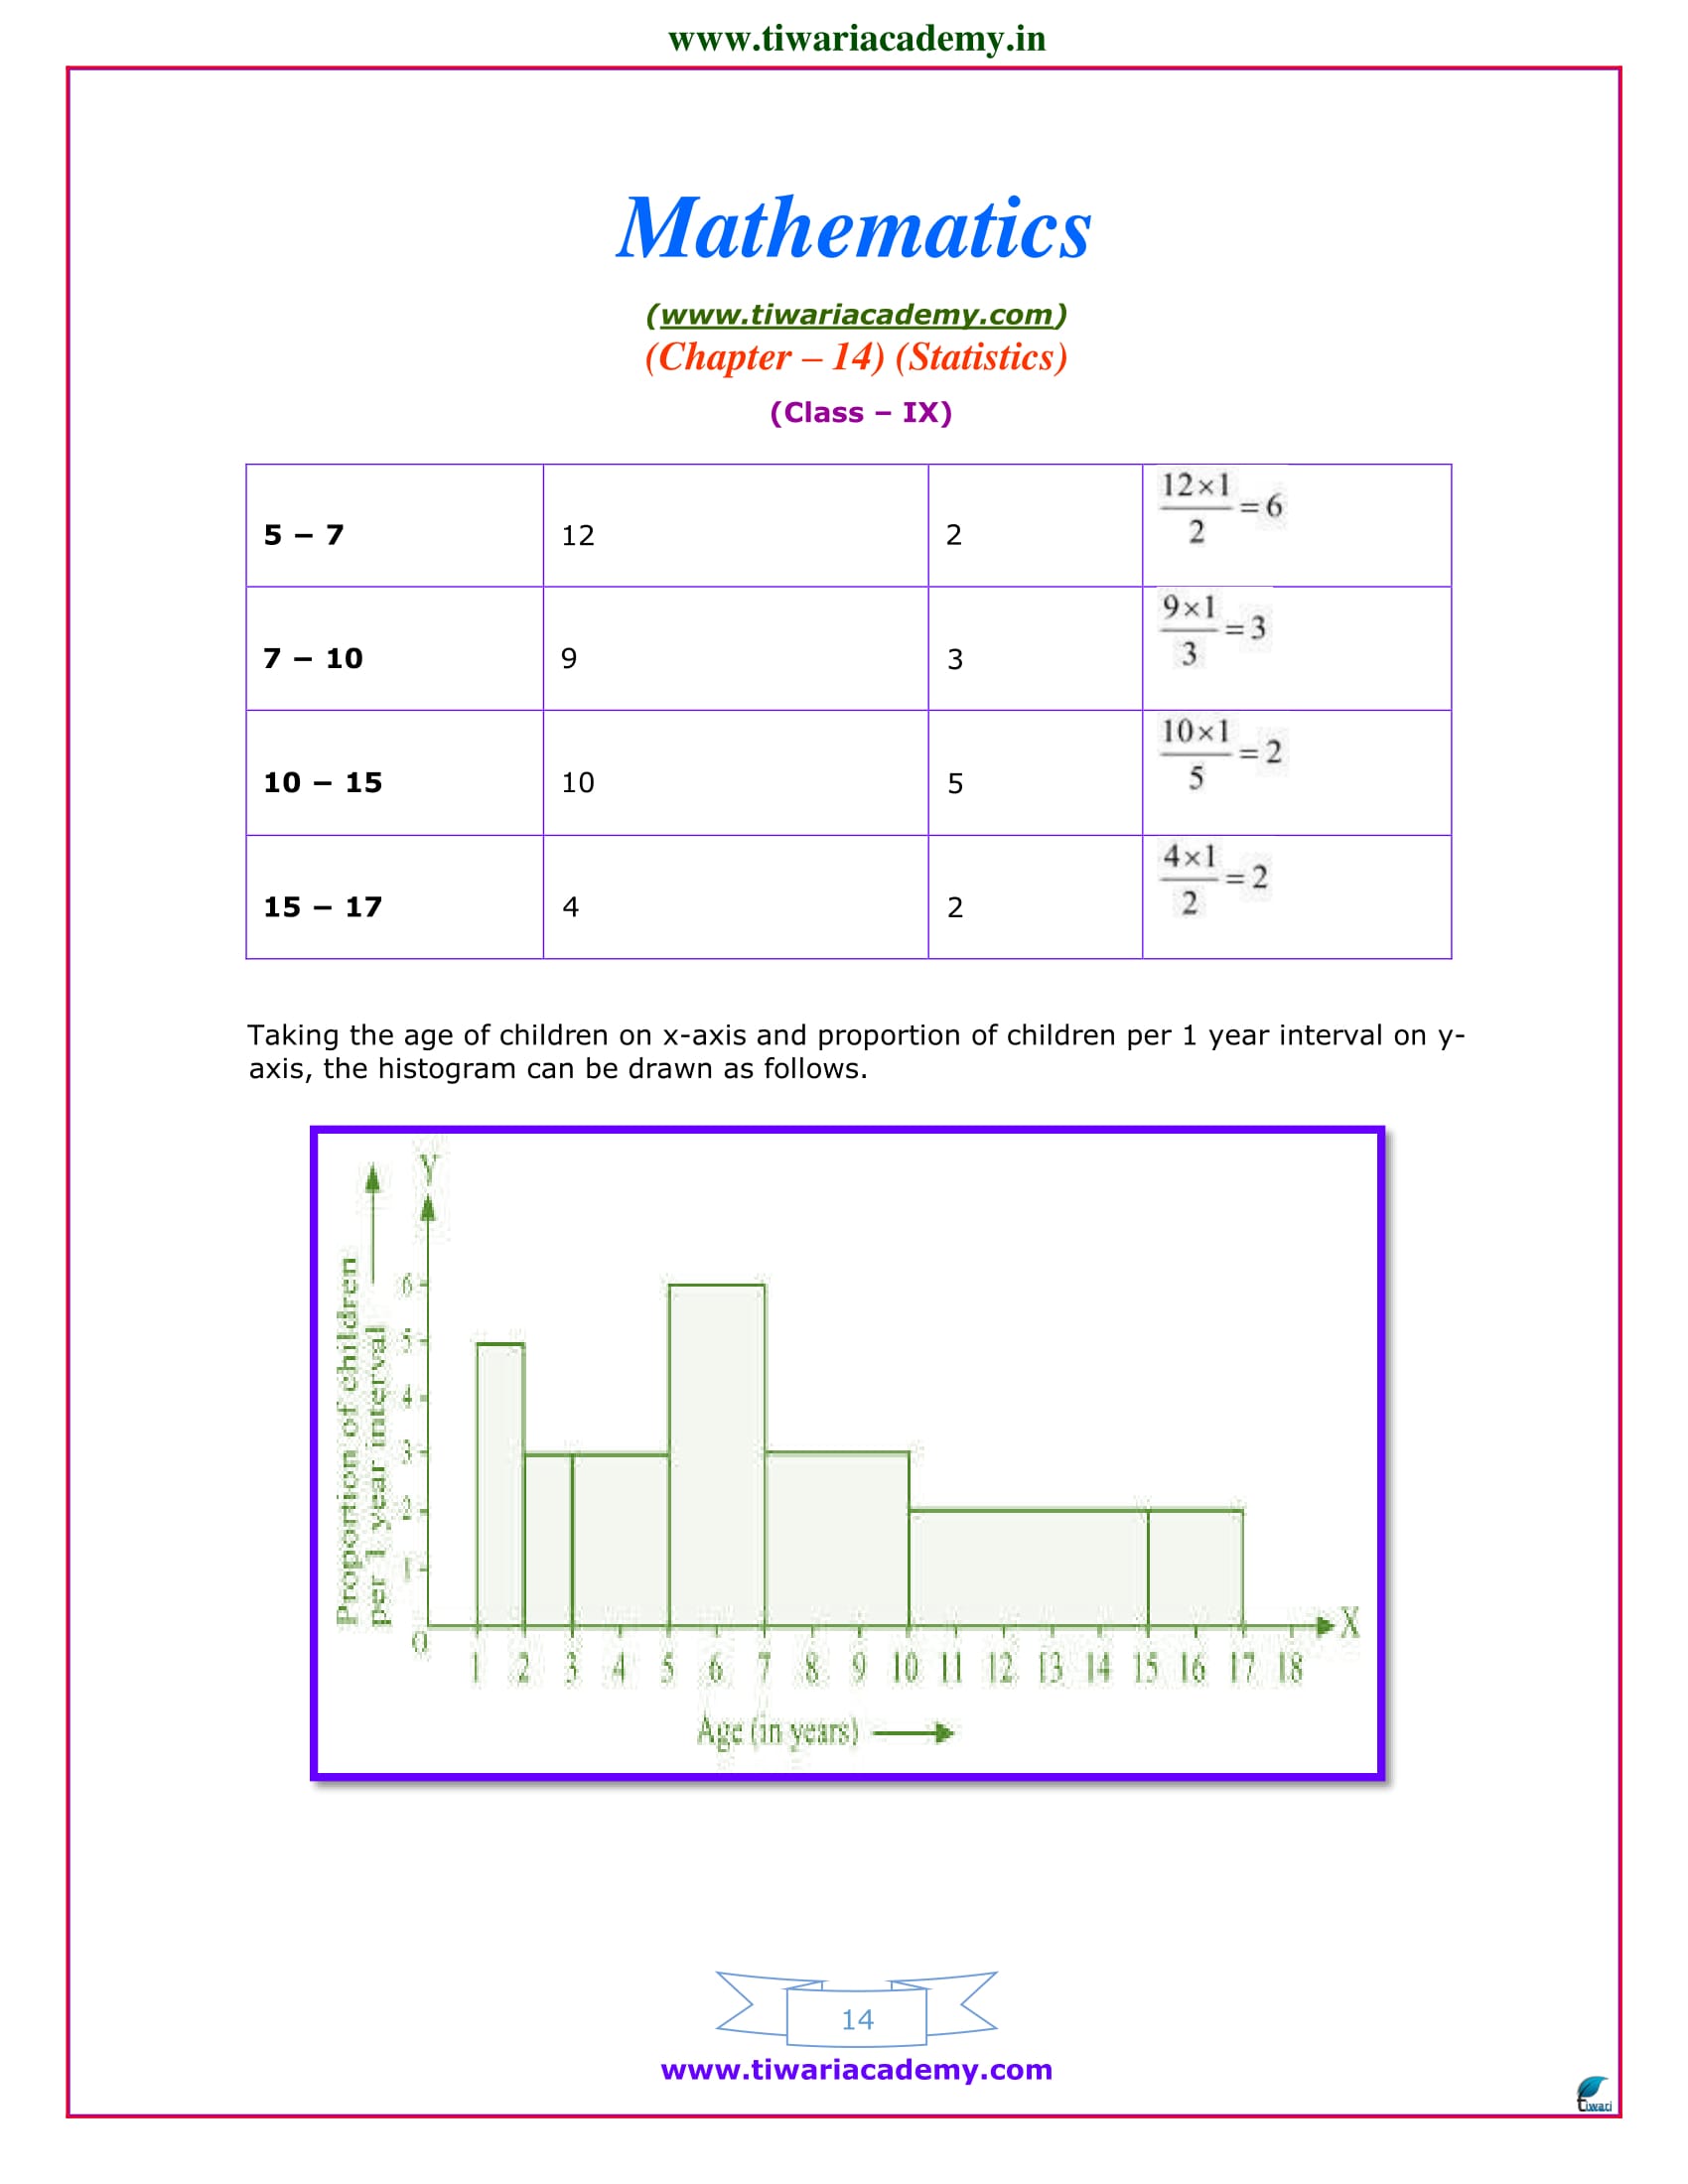
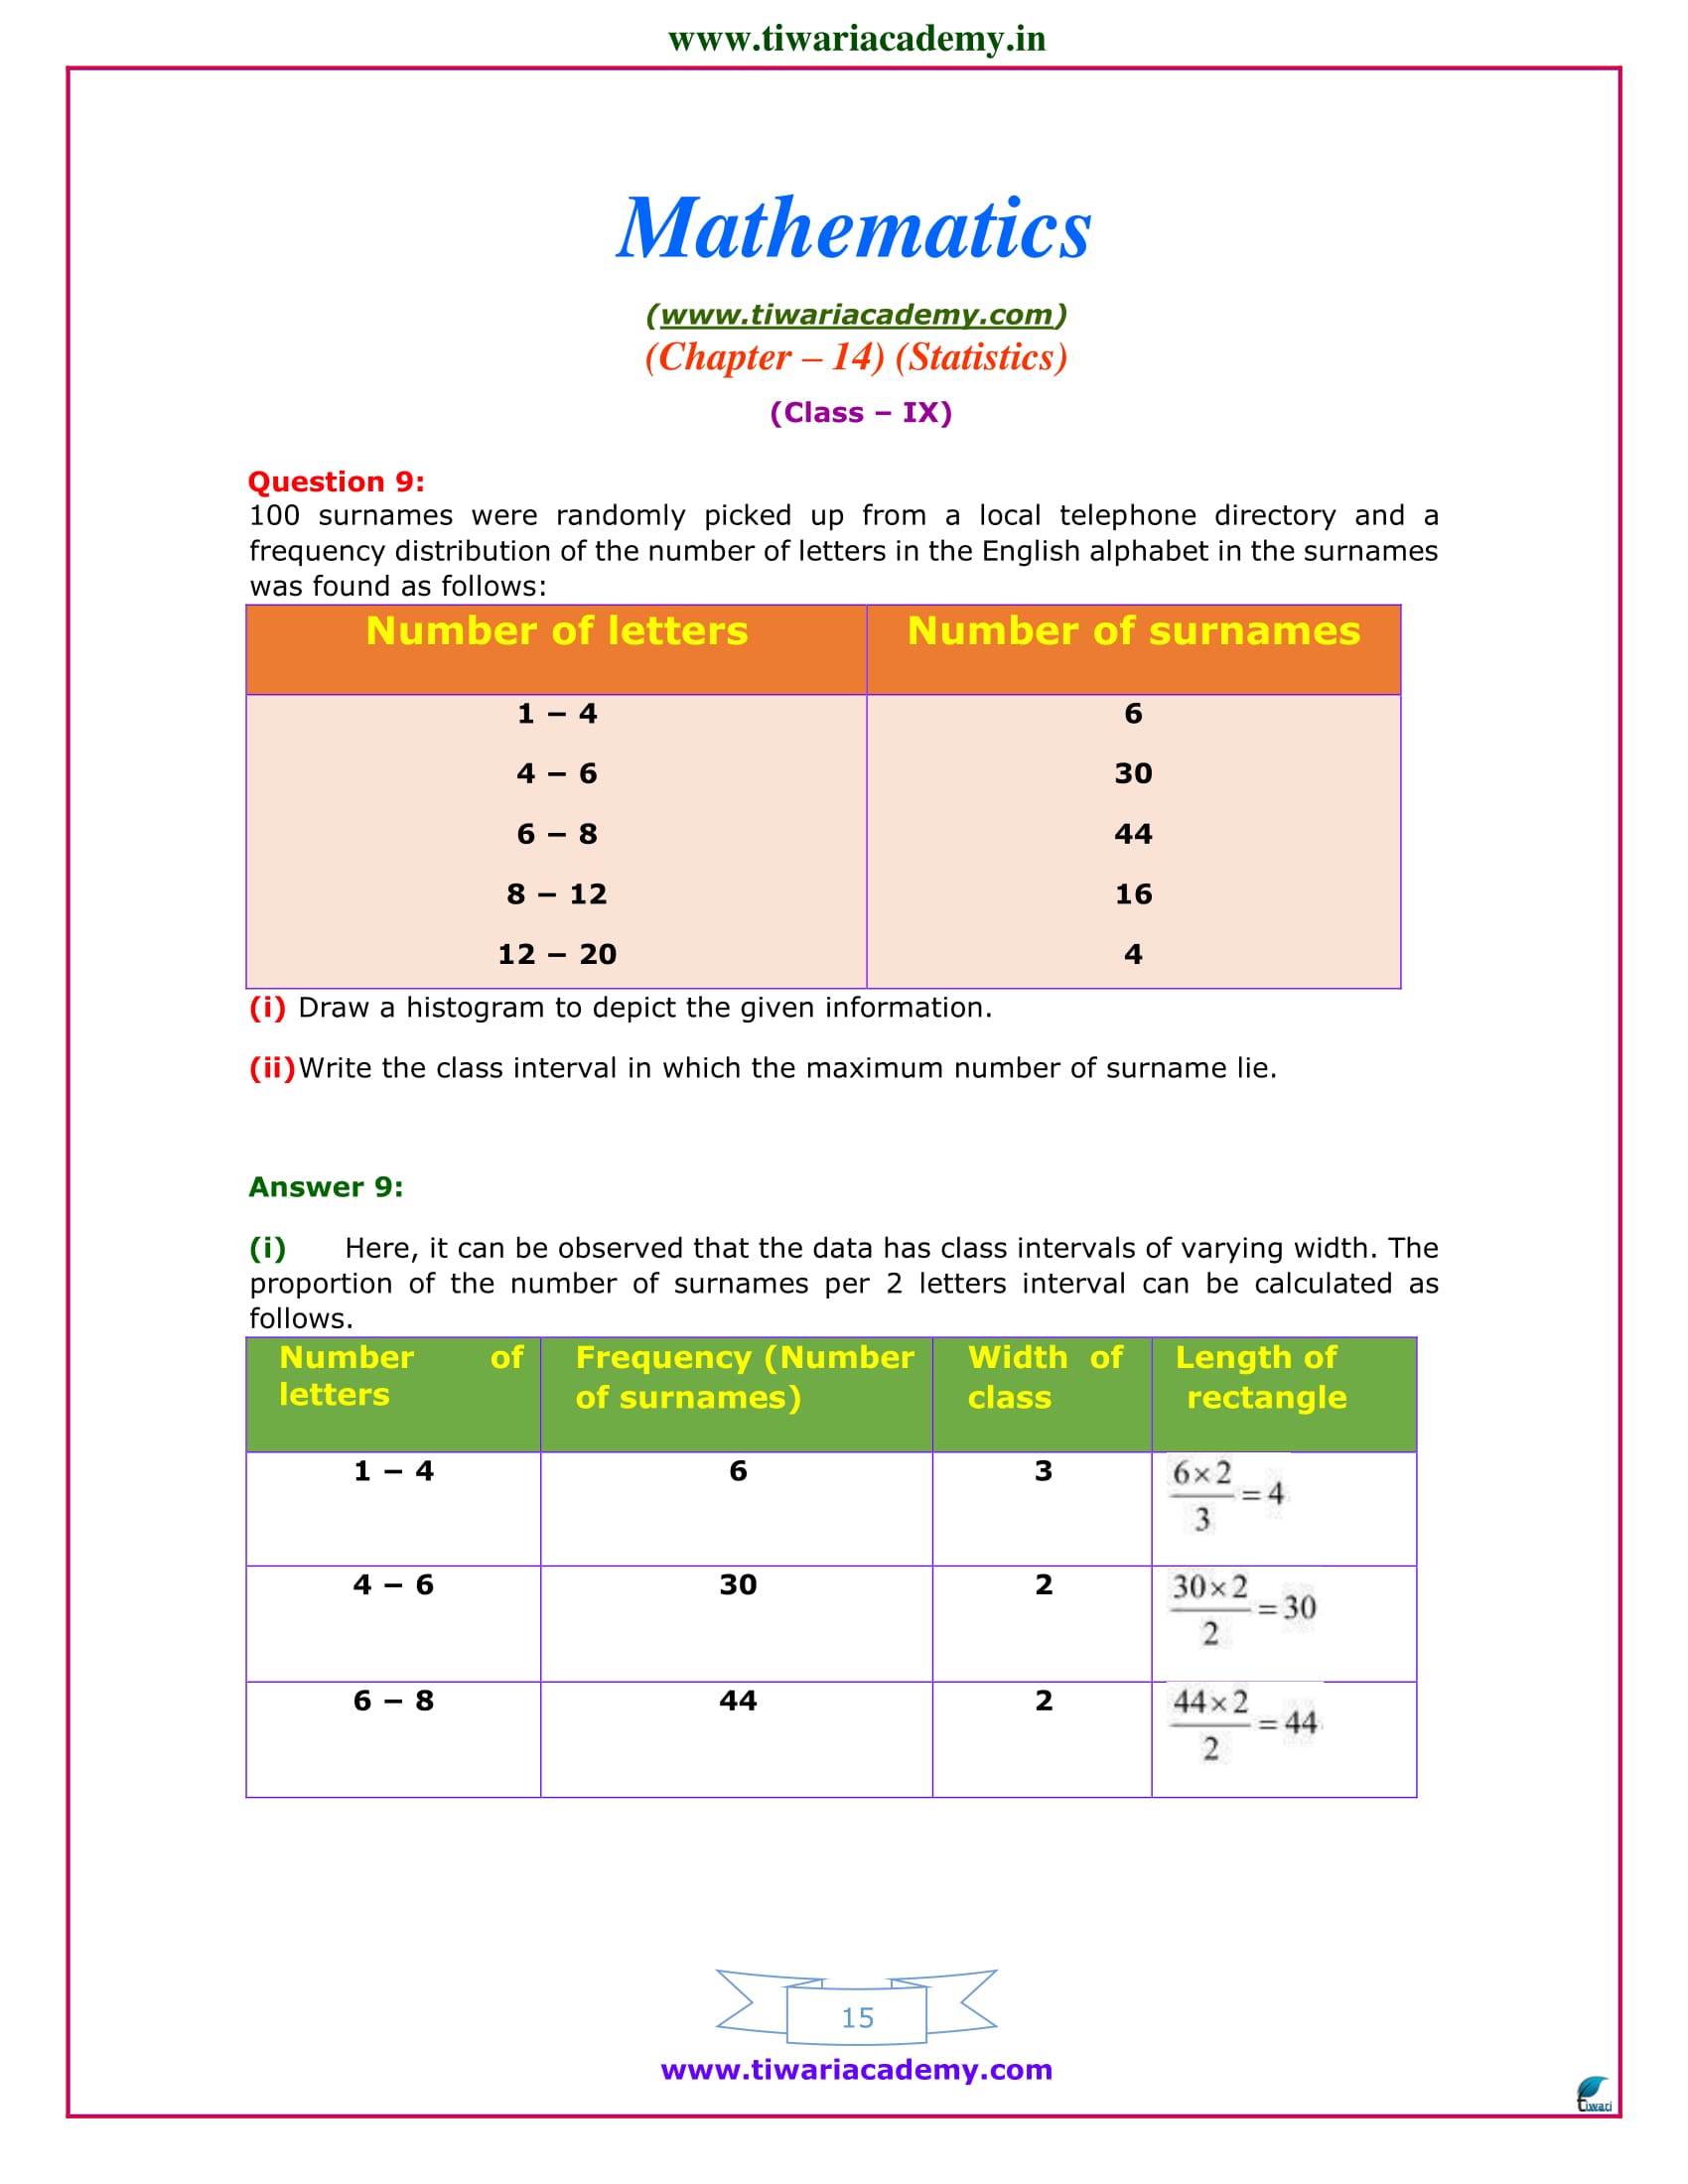
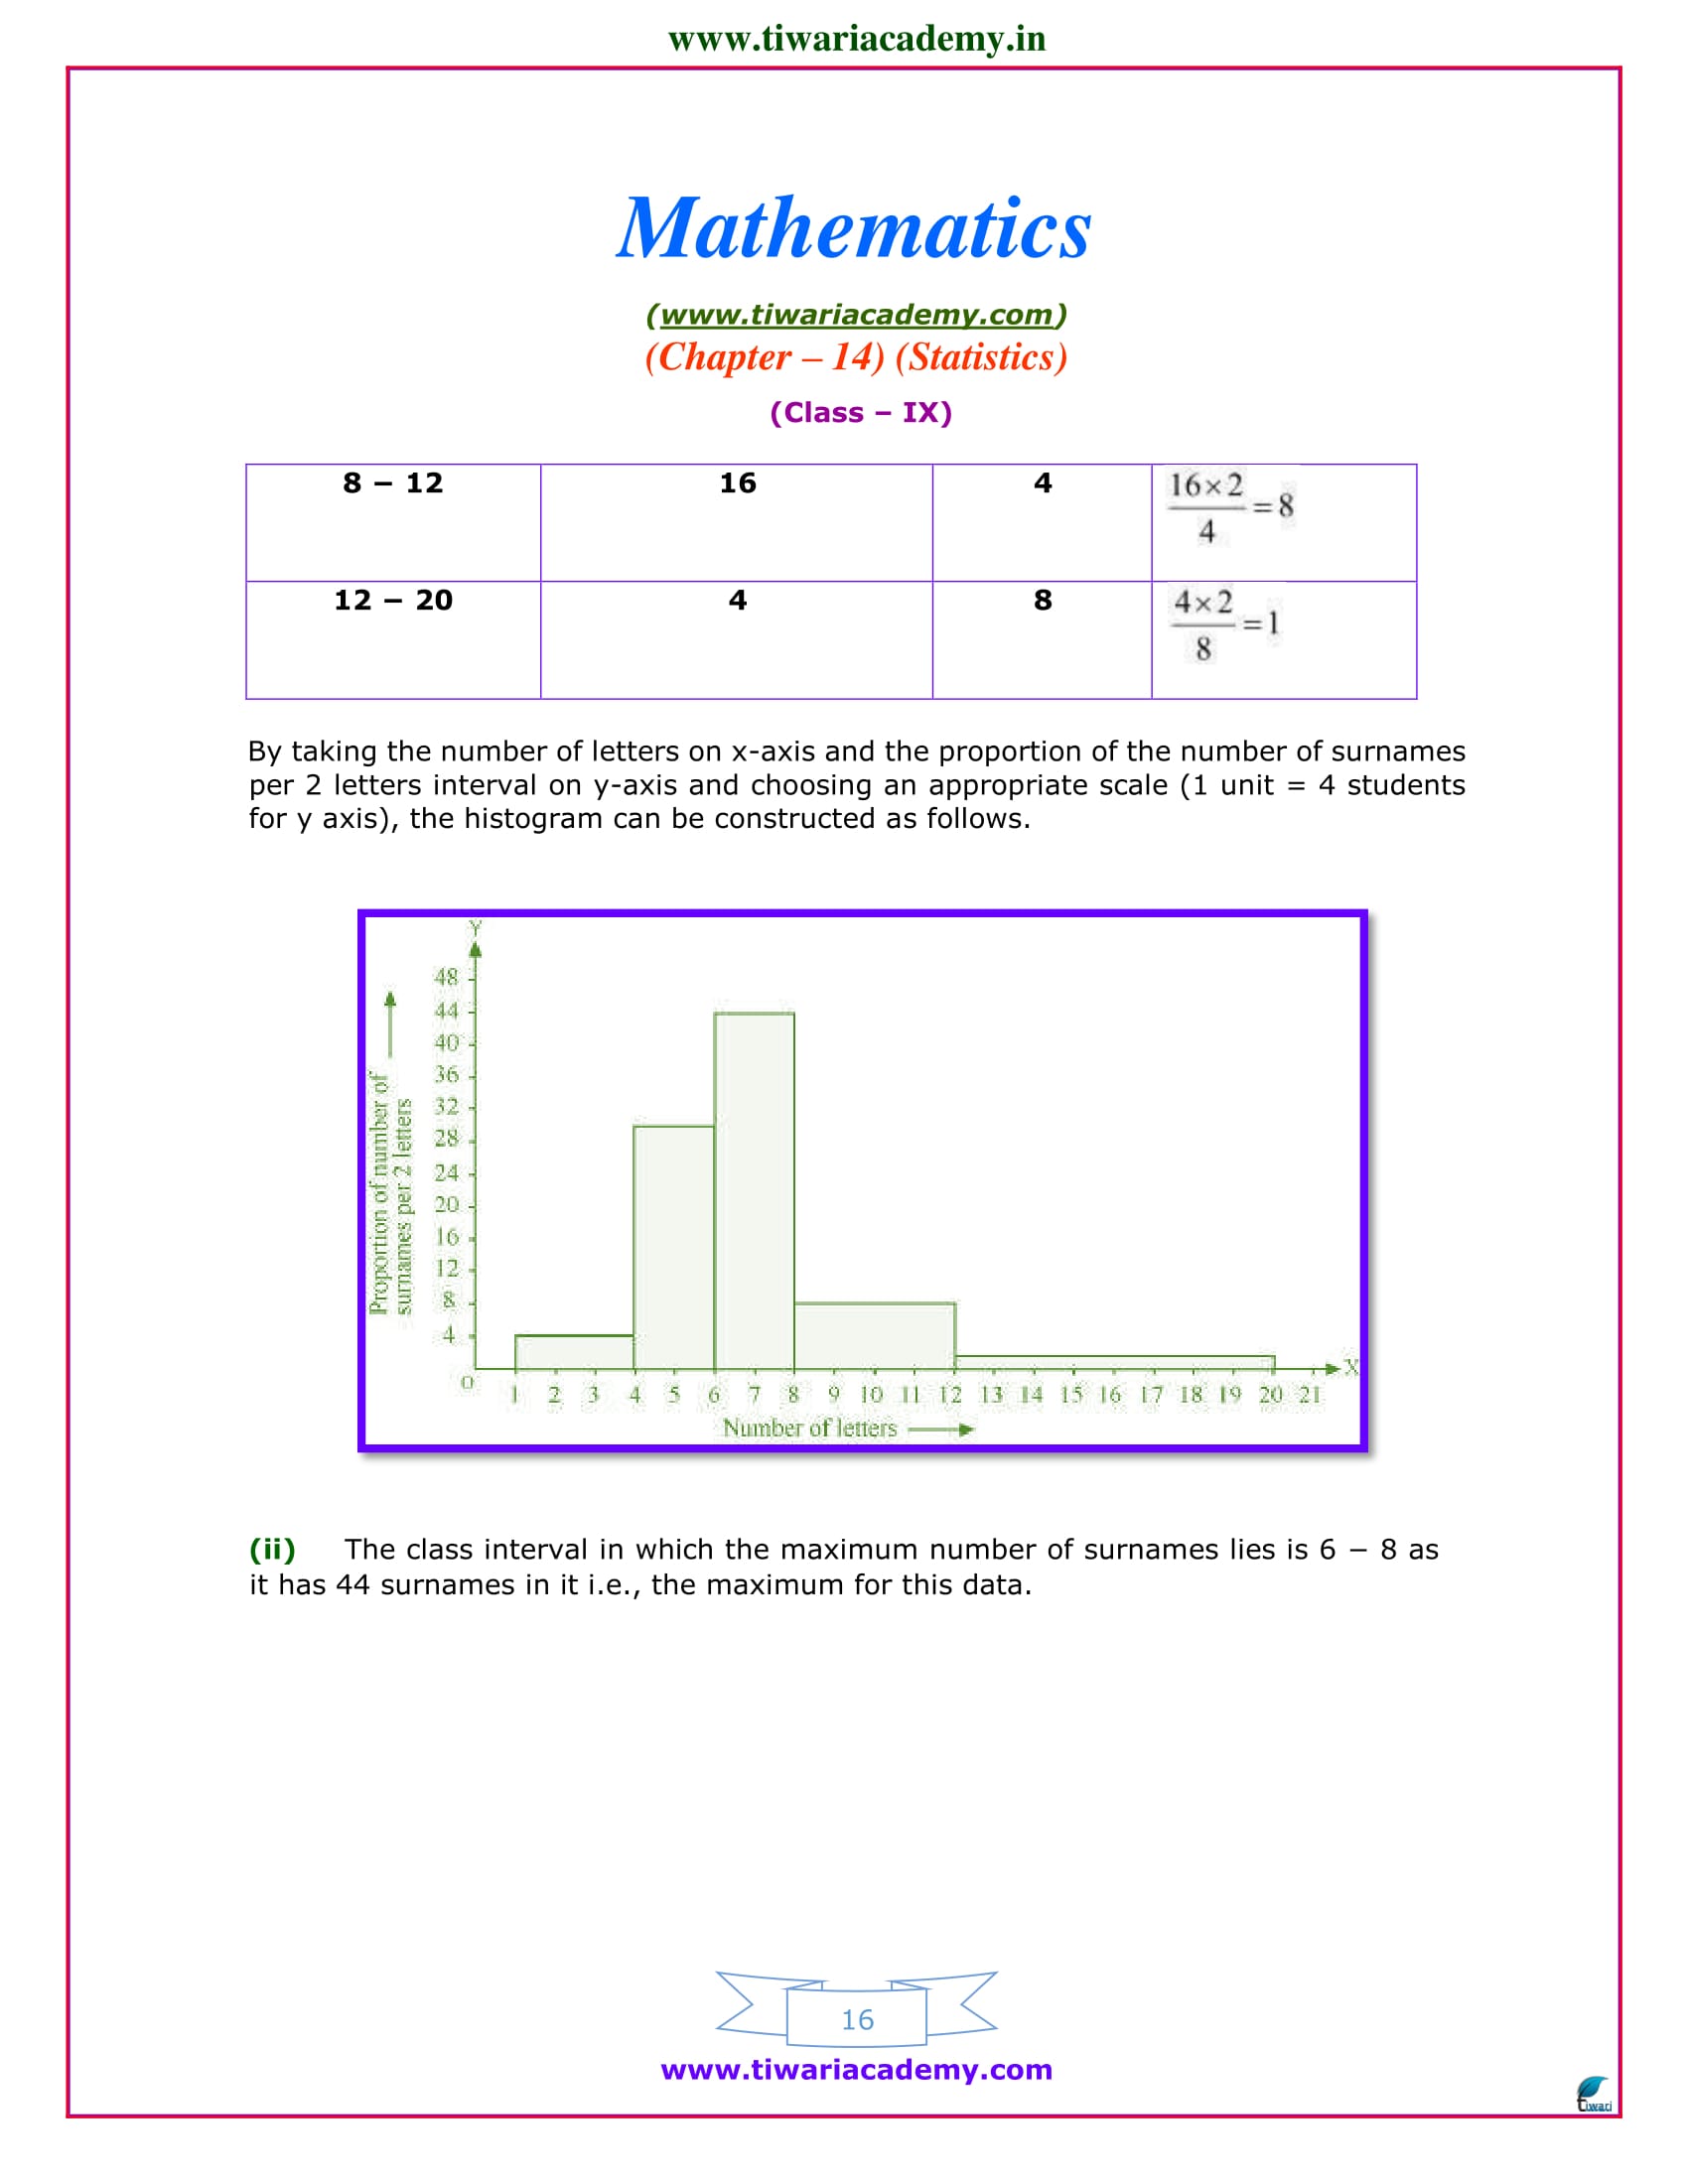
9 Maths Chapter 14 Exercise 14.3 in Hindi
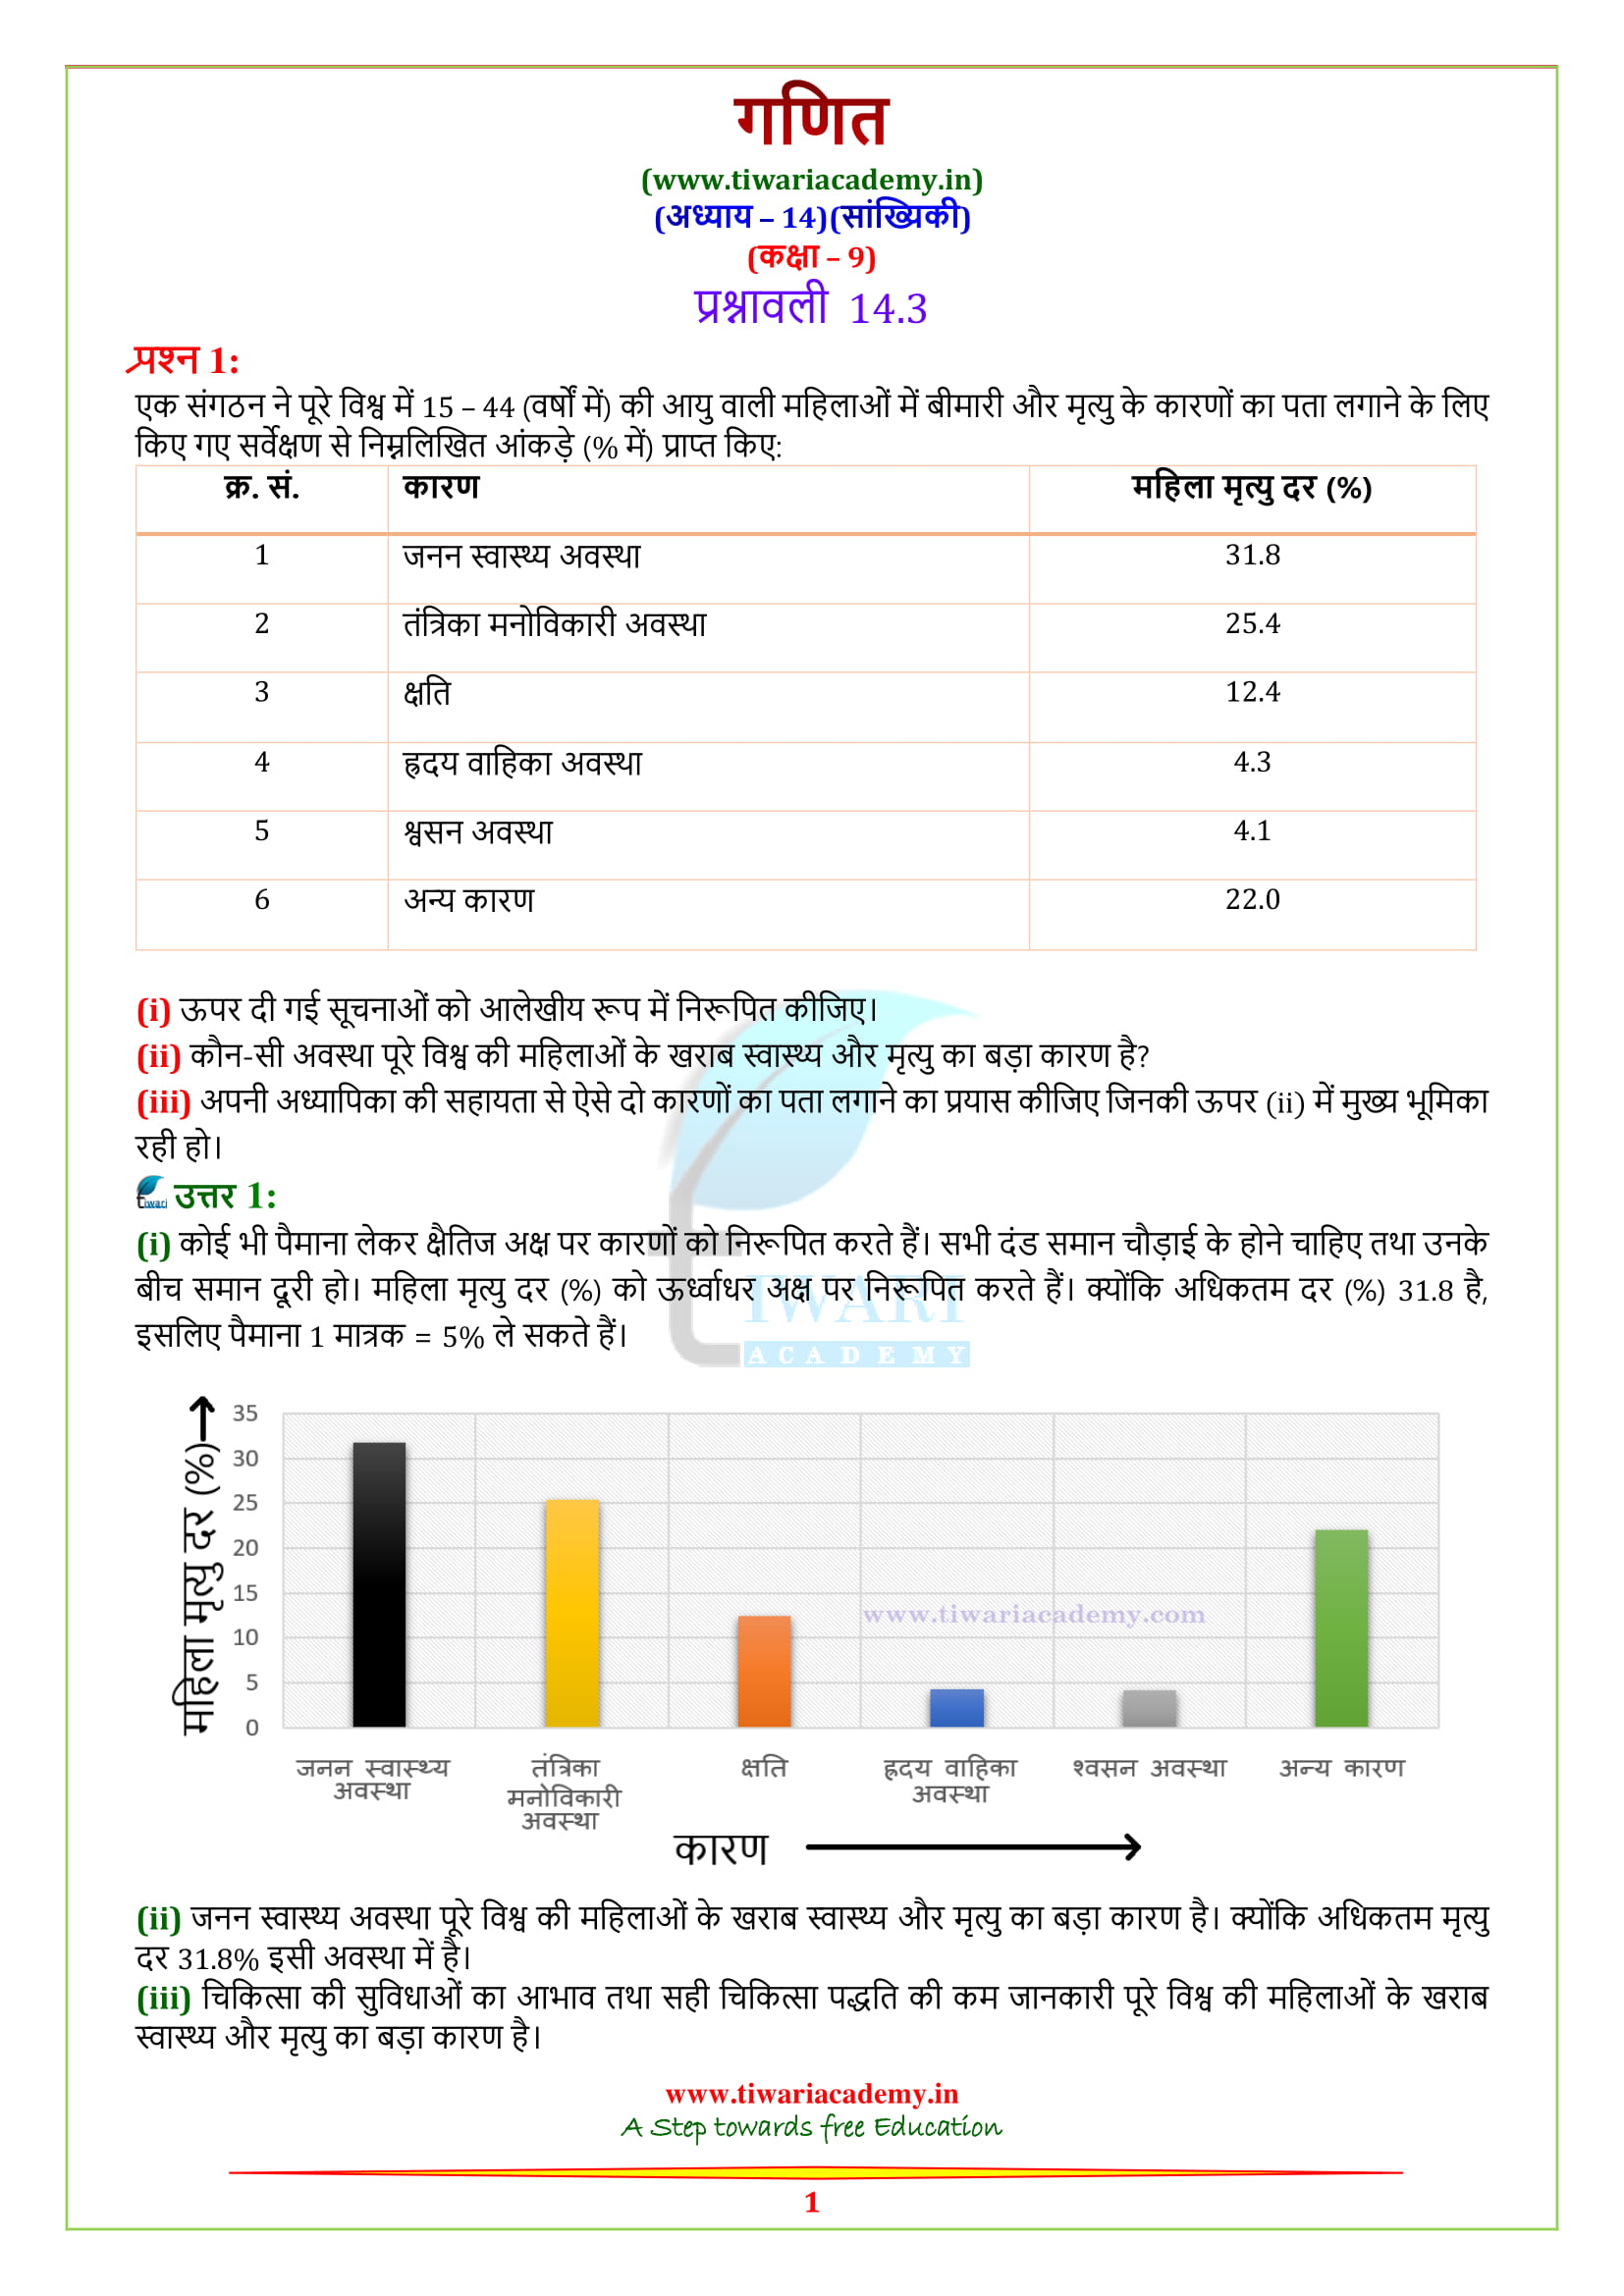
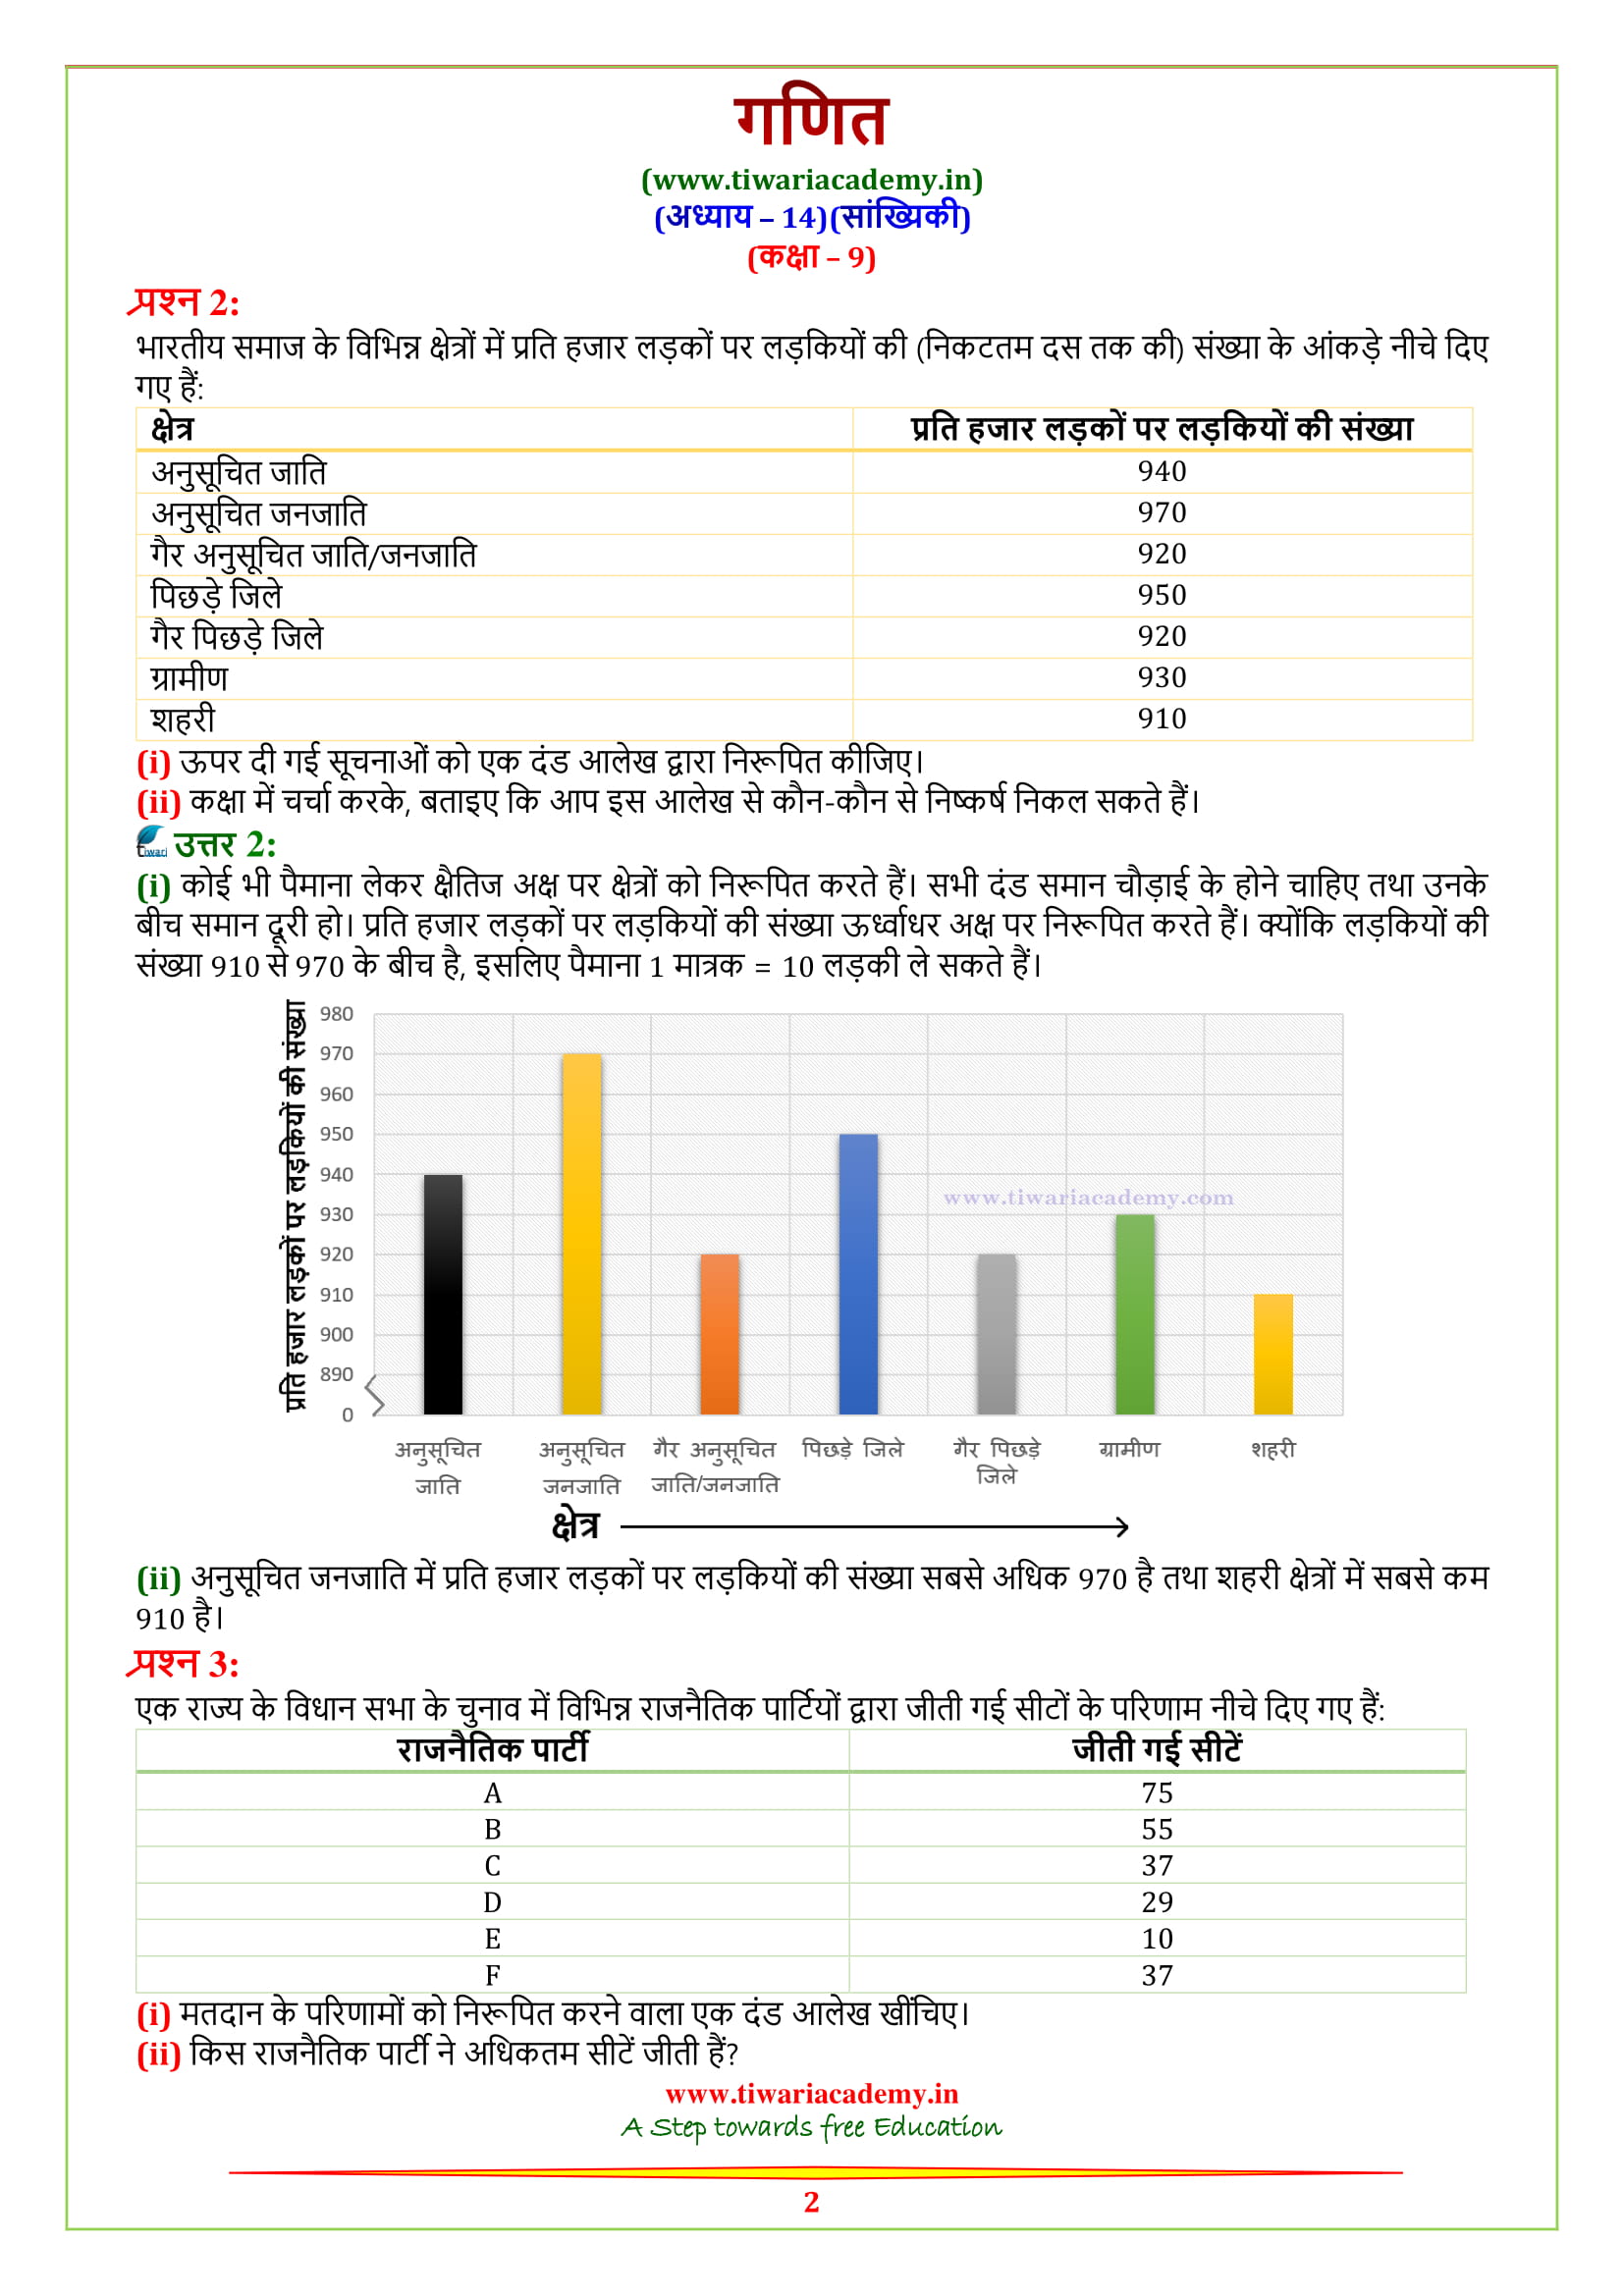
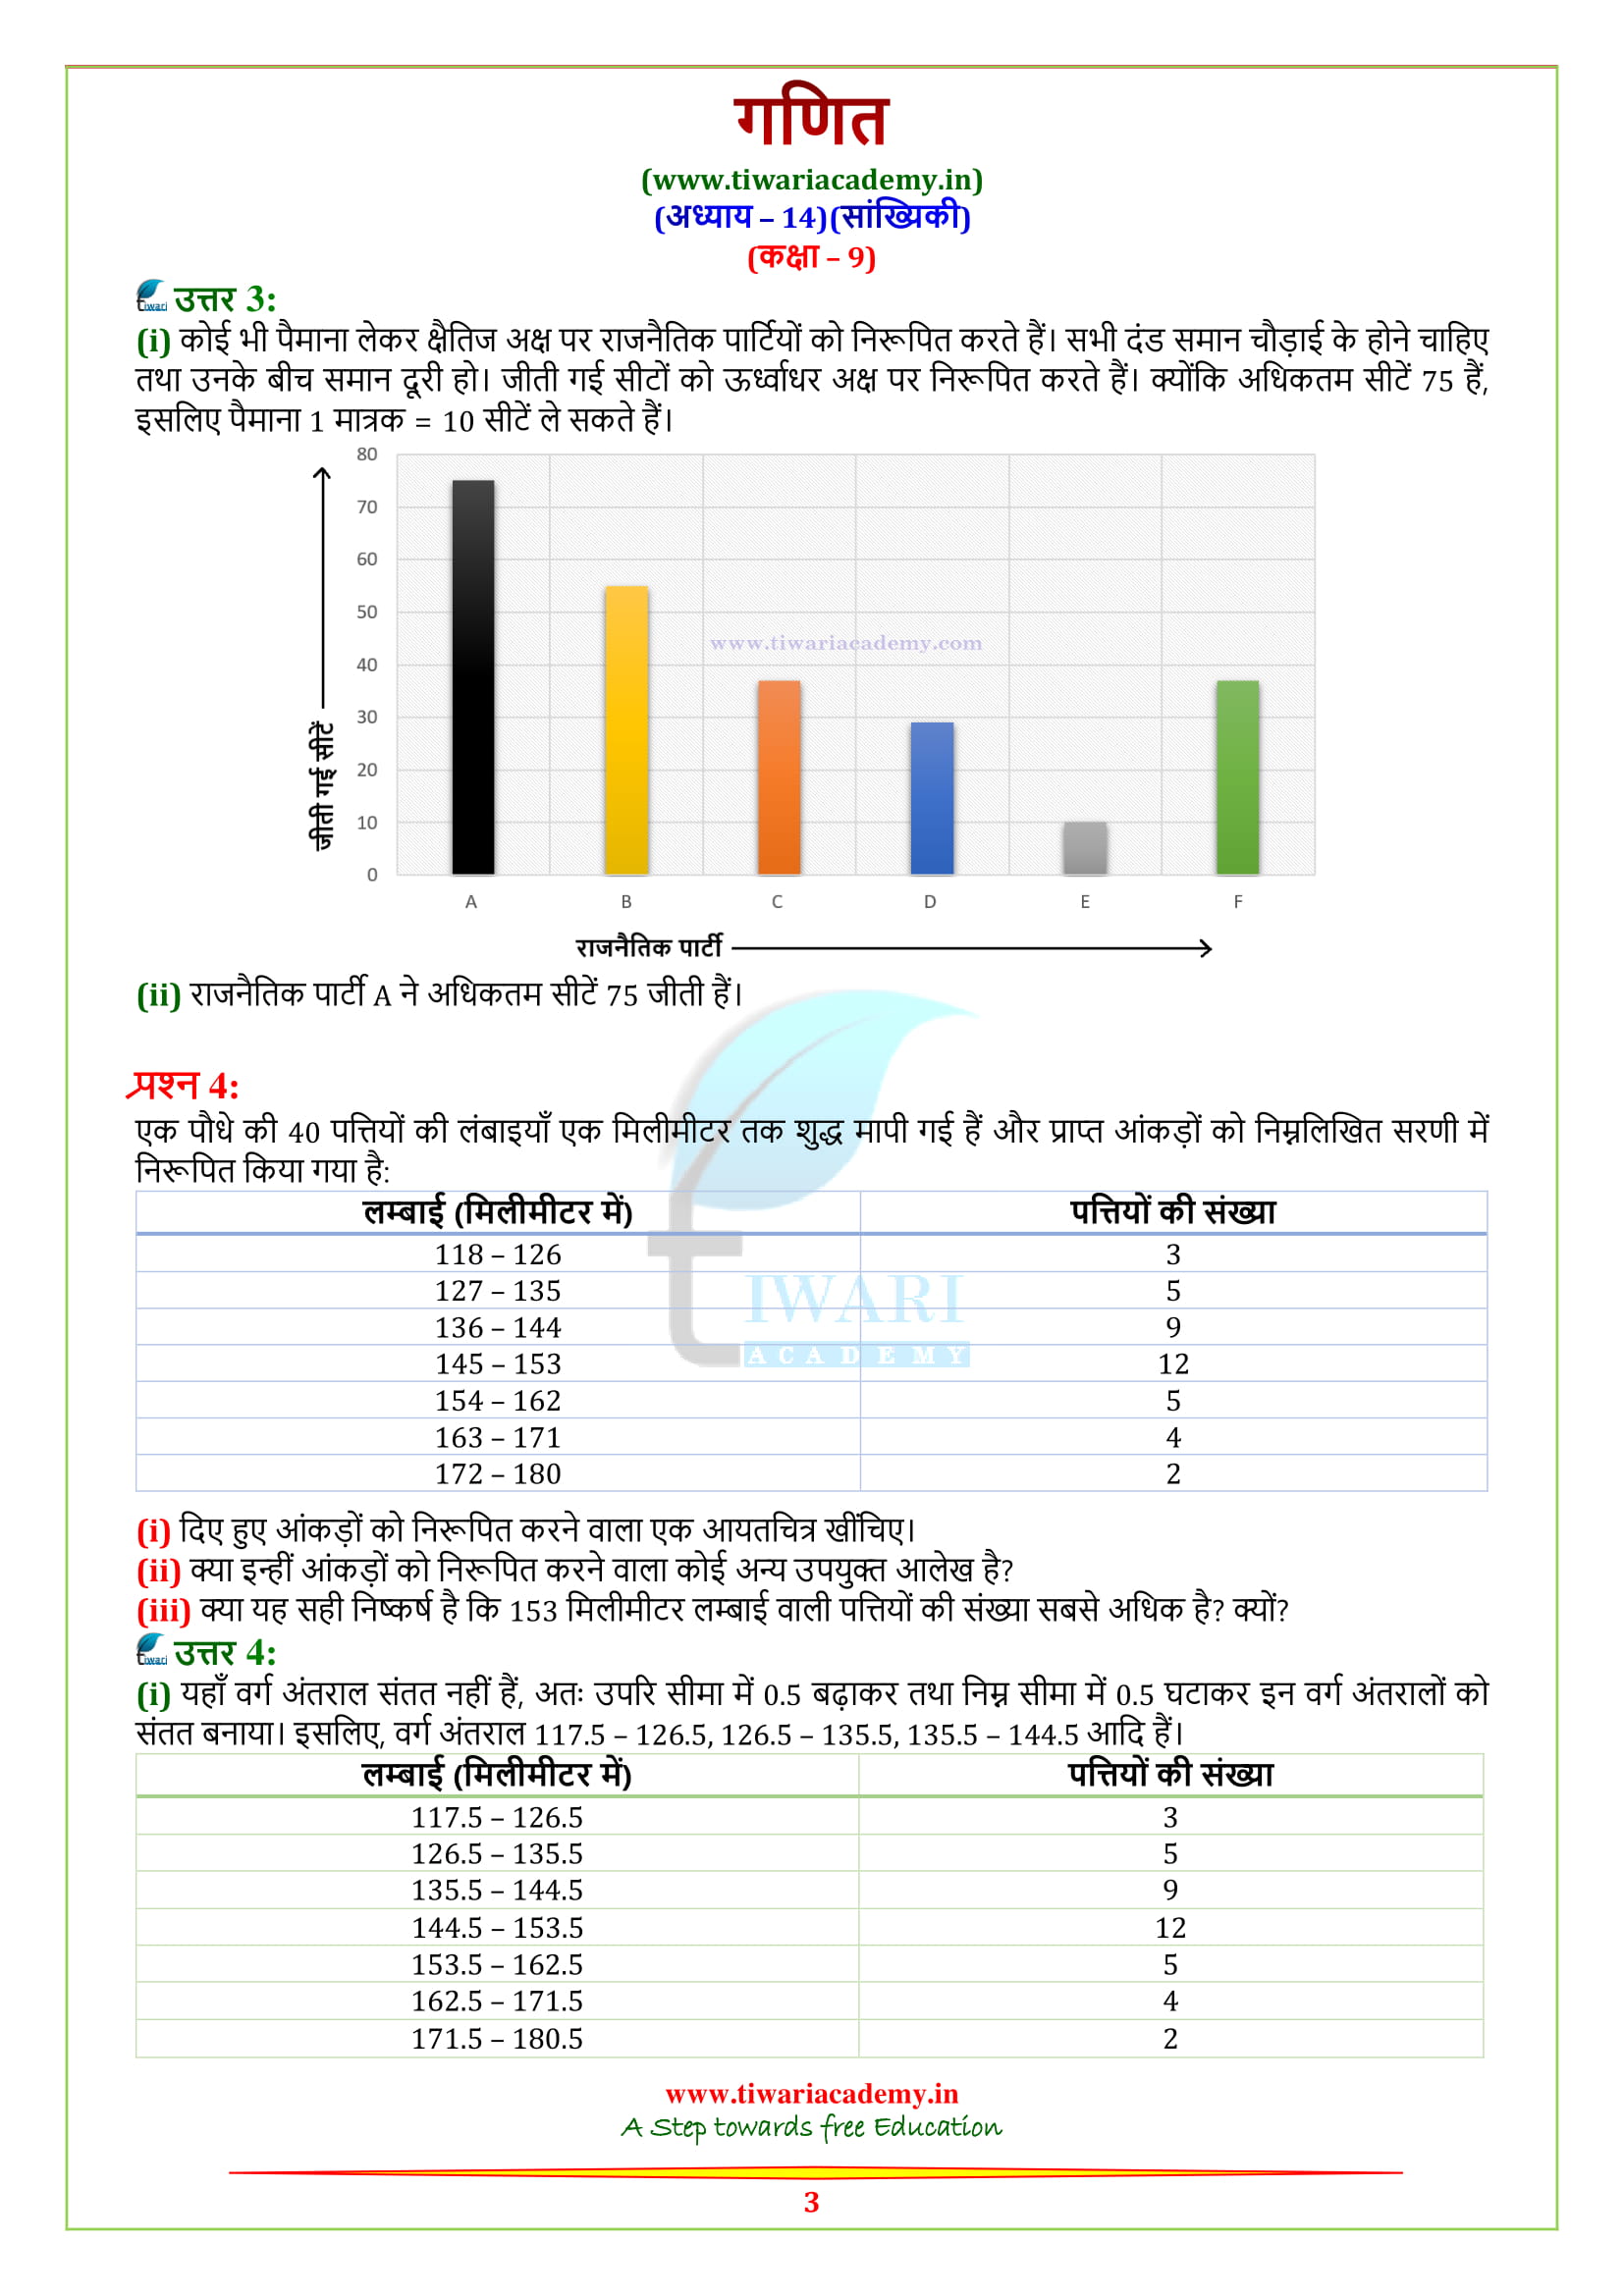
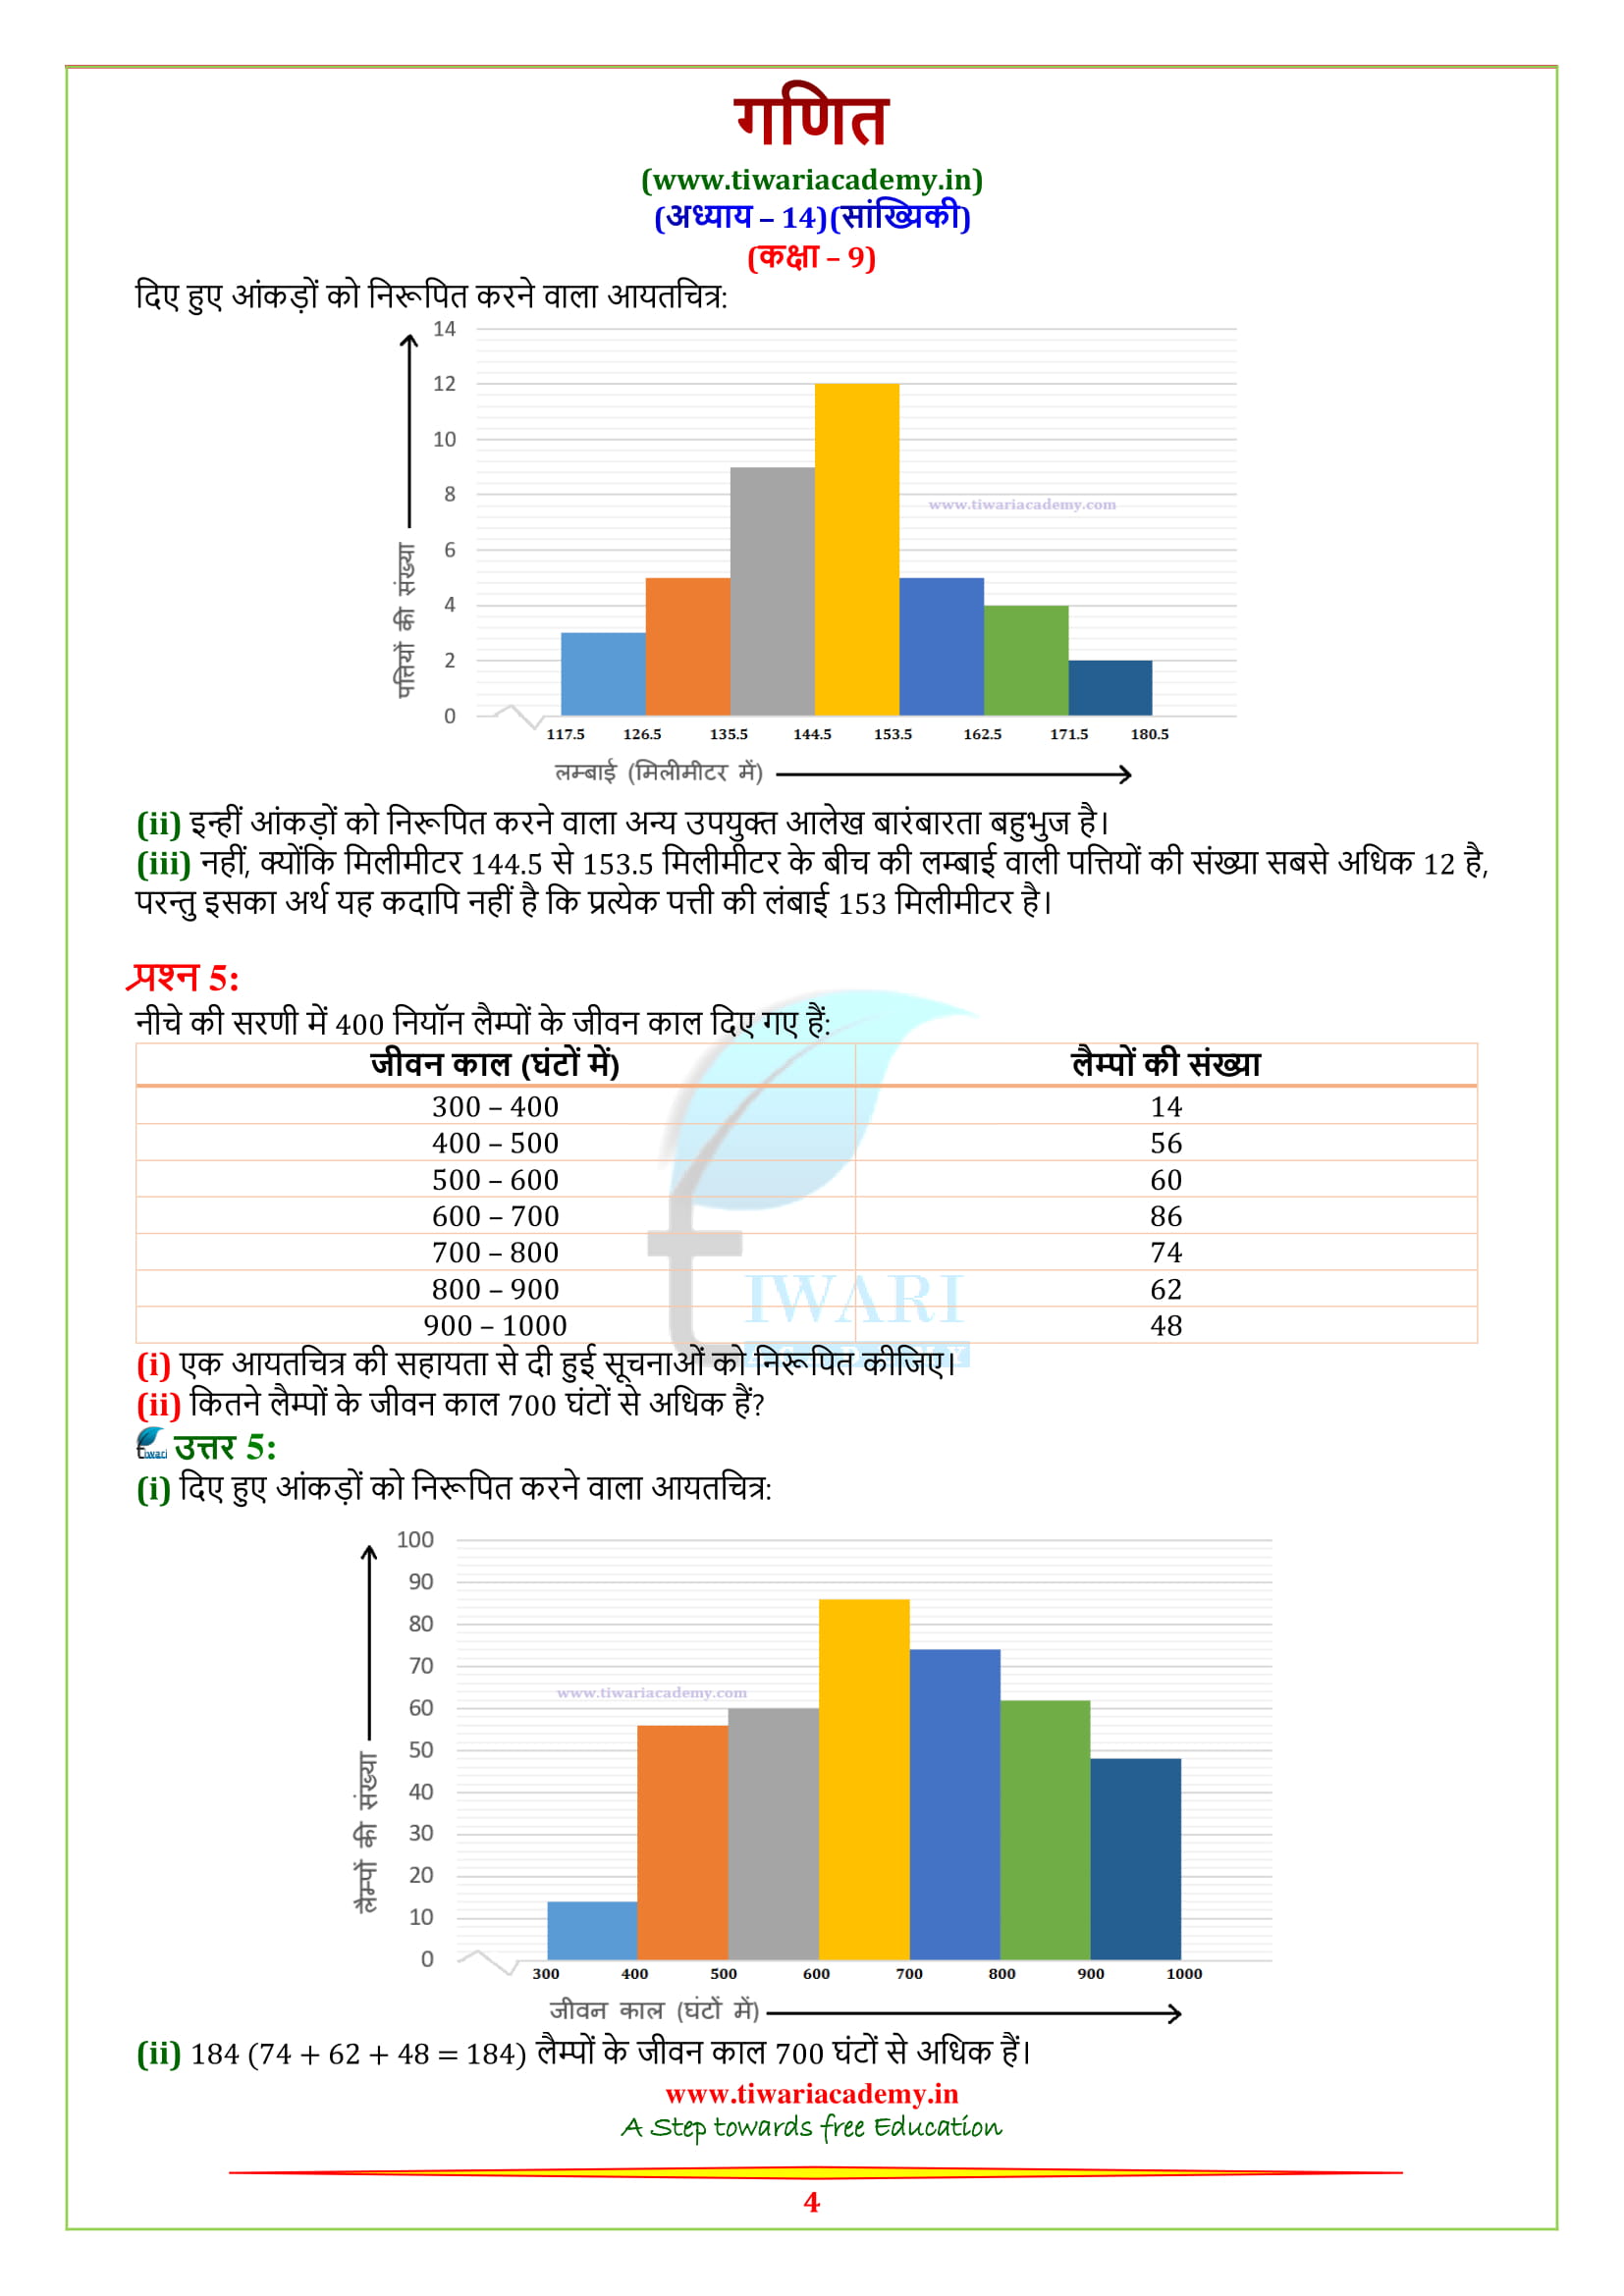
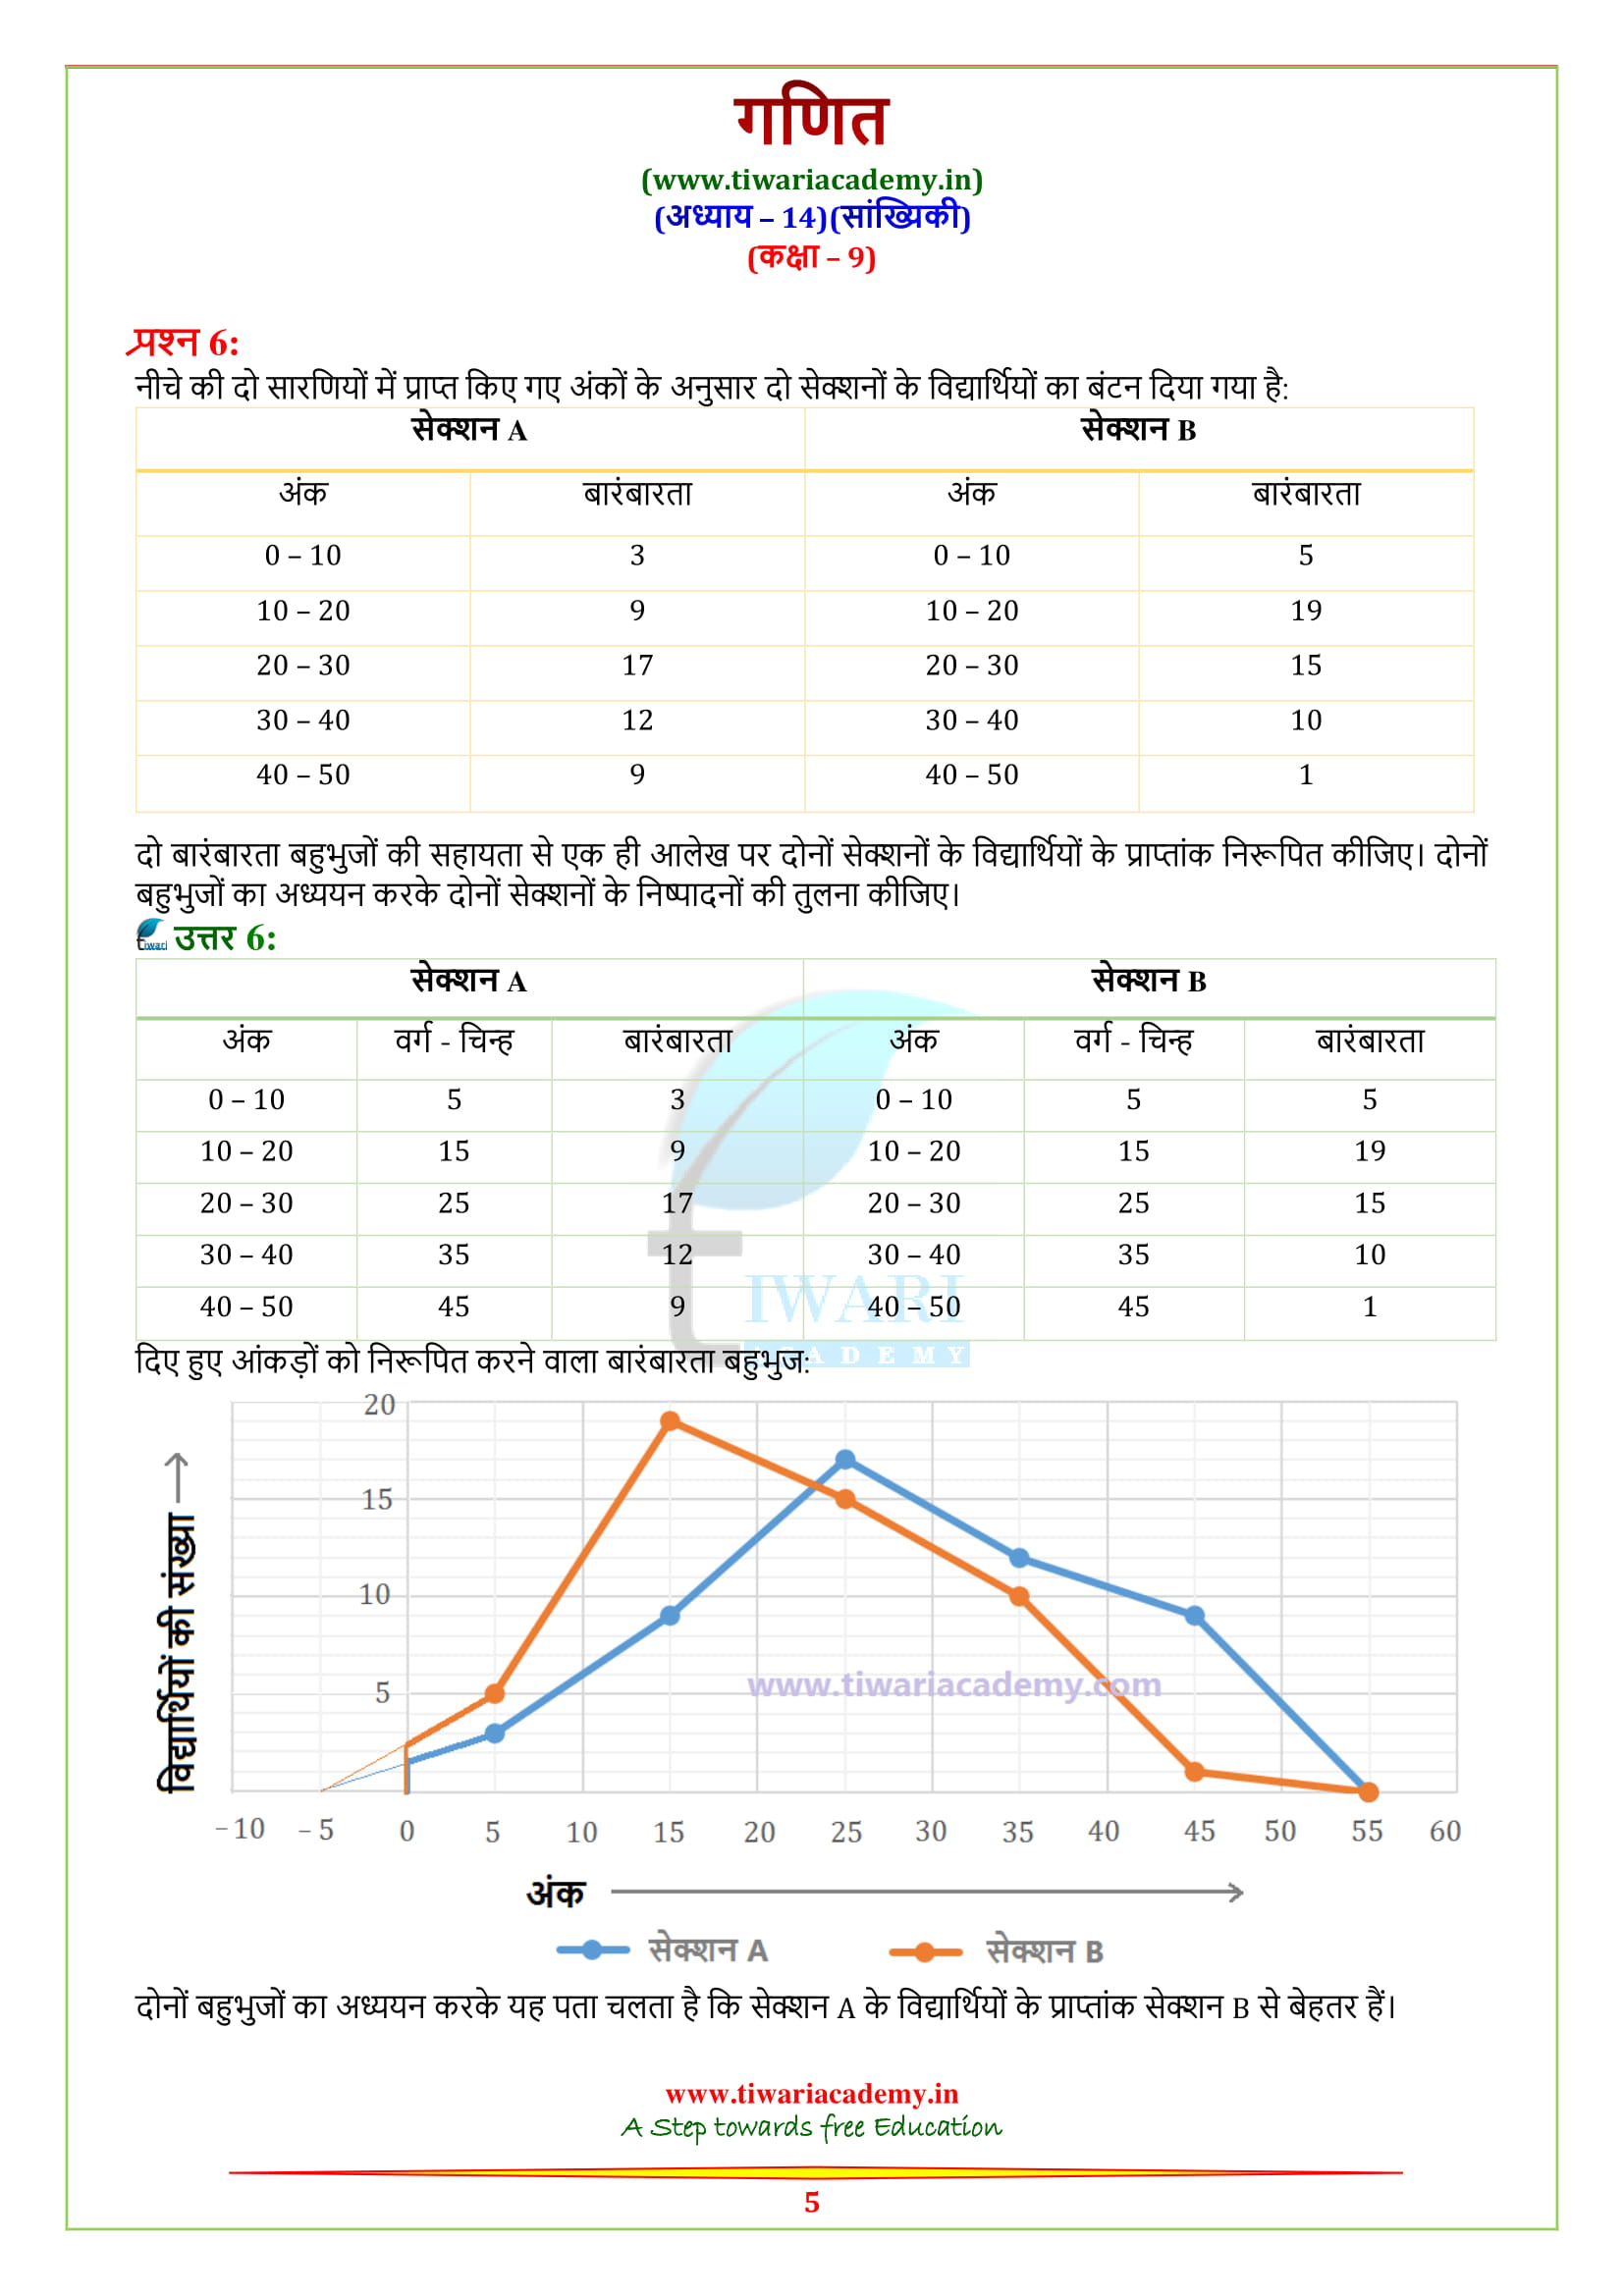
To get the solutions in English, Click for English Medium solutions.
Class 9 Maths Chapter 14 Statistics
Important Questions for Practice [With Answers]
- For what value of x the mode of the following data is 17. The frequency of x is maximum. 13, 24, 13, 27, 17, 16, 17, x, 22, 21, 13, 17. [Answer: 17]
- The average of age of Shikha and her husband Amit is 48 years. The average age of Shikha, Amit and their daughter Advika is 39 years. Find the age of Advika. [Answer: 21 years]
- The mean of 6, 10, 11, x, 12, y is 10. Also y is 7 more than x. Find the value of x and y. [Answer: x = 7, y = 14]
- In three unit tests of Mathematics Priya got 75, 82 and 90 marks. How many marks must she obtain in Unit Test IV to have an average of 85 in all the four unit tests?
- Time taken in seconds by 25 students in an examination to solve certain question is given below:
20, 16, 20, 26, 27, 28, 30, 33, 37, 50, 40, 46, 38, 43, 46, 46, 48, 49, 53, 58, 59, 60, 64, 52. By taking class interval of 10 seconds, make a frequency distribution table. - Find the mean from the following table
- x 5 15 25 35 45
- f 6 4 9 6 5 [Answer: 25]
- Draw the histogram from the following data
- Class 0-10 10-20 20-30 30-40 40-50
- Frequency 8 15 20 12 16
- Given below is a cumulative frequency distribution table showing the marks scored by 50 students of a class.
- Marks Number of students
Below 20 17
Below 40 22
Below 60 29
Below 80 37
Below 100 50
Form a frequency table from the above data.
- Marks Number of students
- Given below are the seats won by different Political parties in the poling outcome of a state assembly election.
- Political party A B C D E F G
- Seat won 75 55 37 29 10 37 50
Draw a bar graph for above data.
- Find the value of ‘p’ from the following distribution if the mean is 6.
- xi 2 4 6 10 p+5
- fi 3 2 3 1 2 [Answer: p = 7]
- Given below is the data of school students who participated in different activities.
Activity sports meditation yoga walking
No. of girls 42 35 100 120
No. of boys 90 64 130 86
Draw double bar graph.
What values are depicted for these mandatory activities? [Answer: These activities are best for health] - The distance travelled by 40 engineers in (km) from their place of work were found as follows:
5, 3, 10, 20, 25, 11, 13, 7, 12, 31, 19, 10, 12, 17, 18, 11, 32, 17, 16, 2, 7, 9, 7, 8, 3, 5, 12, 15, 18, 3, 12, 14, 2, 9, 6, 15, 15, 7, 6, 12. Construct a group frequency distribution table with class size 5 for the data given above taking first interval 0-5 (5 not included) [Answer: Mean = 15.6, Median = 15 and Mode = 20] - Define the term “Median”. If the median of 6, 7, x – 2, x, 17, 20 written in ascending order is 16. Find the value of x. [Answer: x = 7]

