NCERT Solutions for Class 9 Maths Chapter 14 Exercise 14.4 statistics in English Medium and Hindi Medium free to use online or download. NCERT Solutions for class 9 maths all chapters with complete explanations in PDF. Other exercises like Exercise 14.1 or Exercise 14.2 or Exercise 14.3 are given to use online or download to use it offline.
NCERT Solutions for Class 9 Maths Chapter 14 Exercise 14.4
If you need solutions in Hindi, Click for Hindi Medium solutions of 10 Maths Exercise 14.4
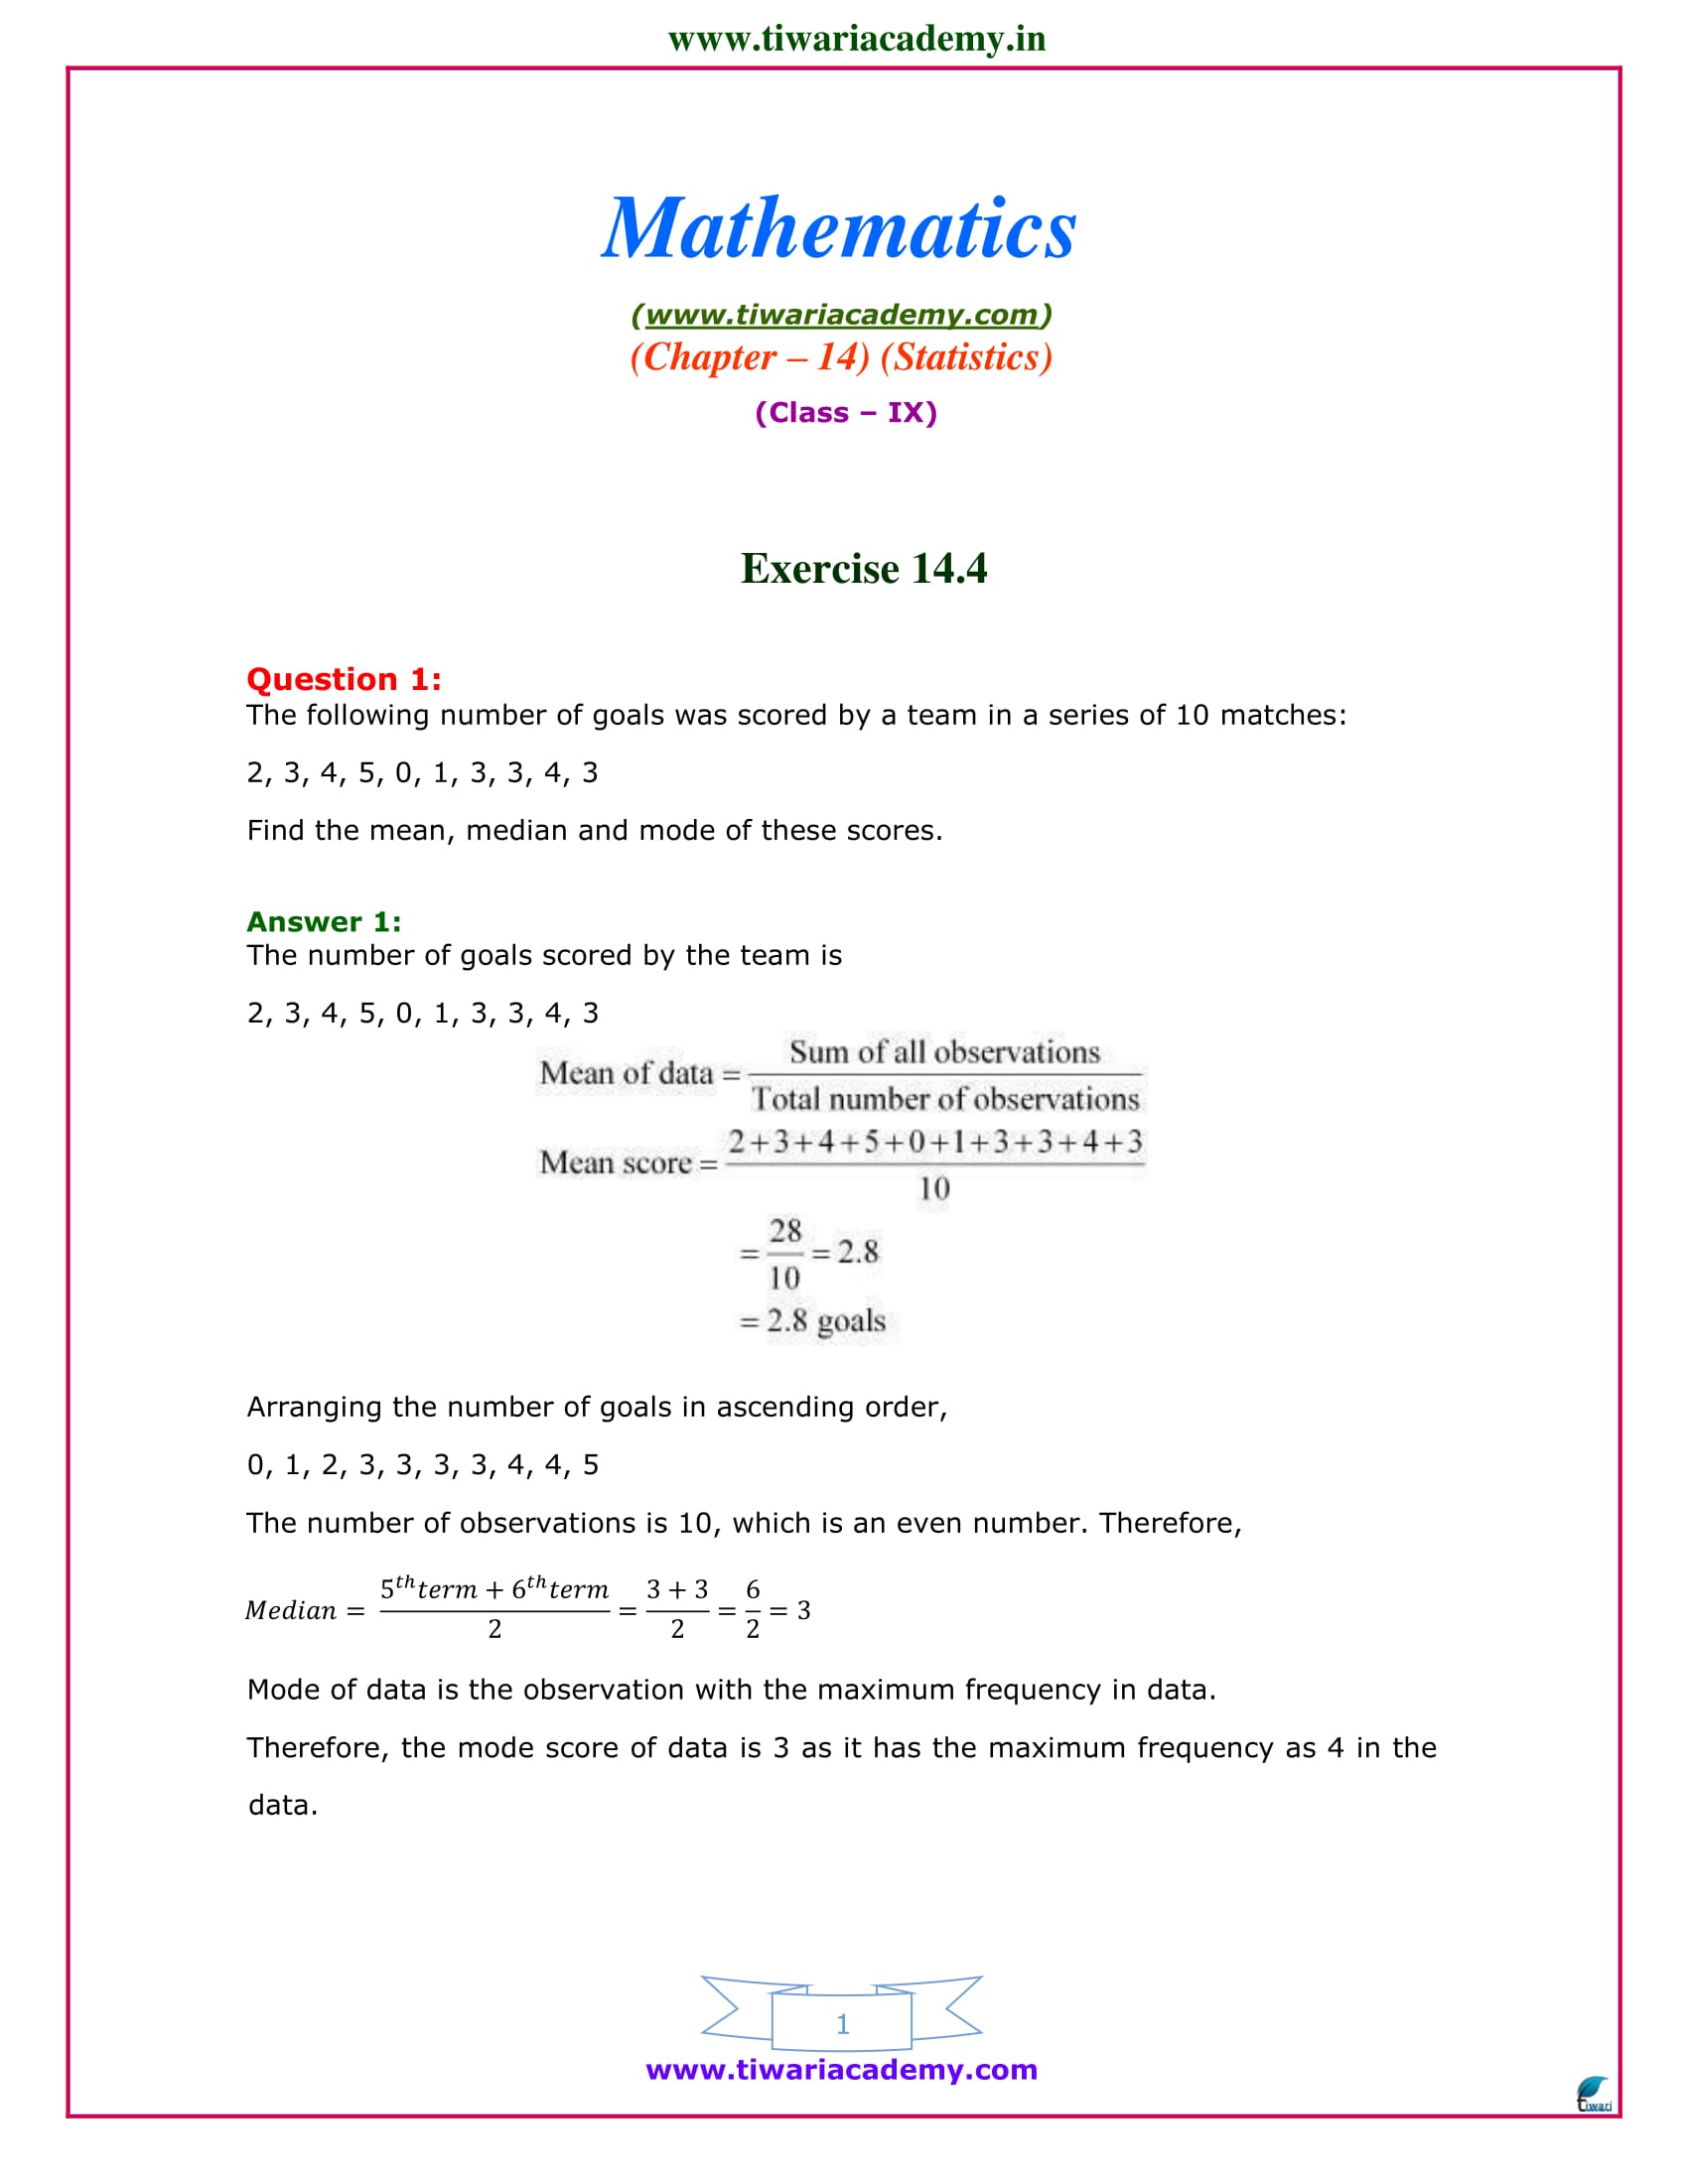
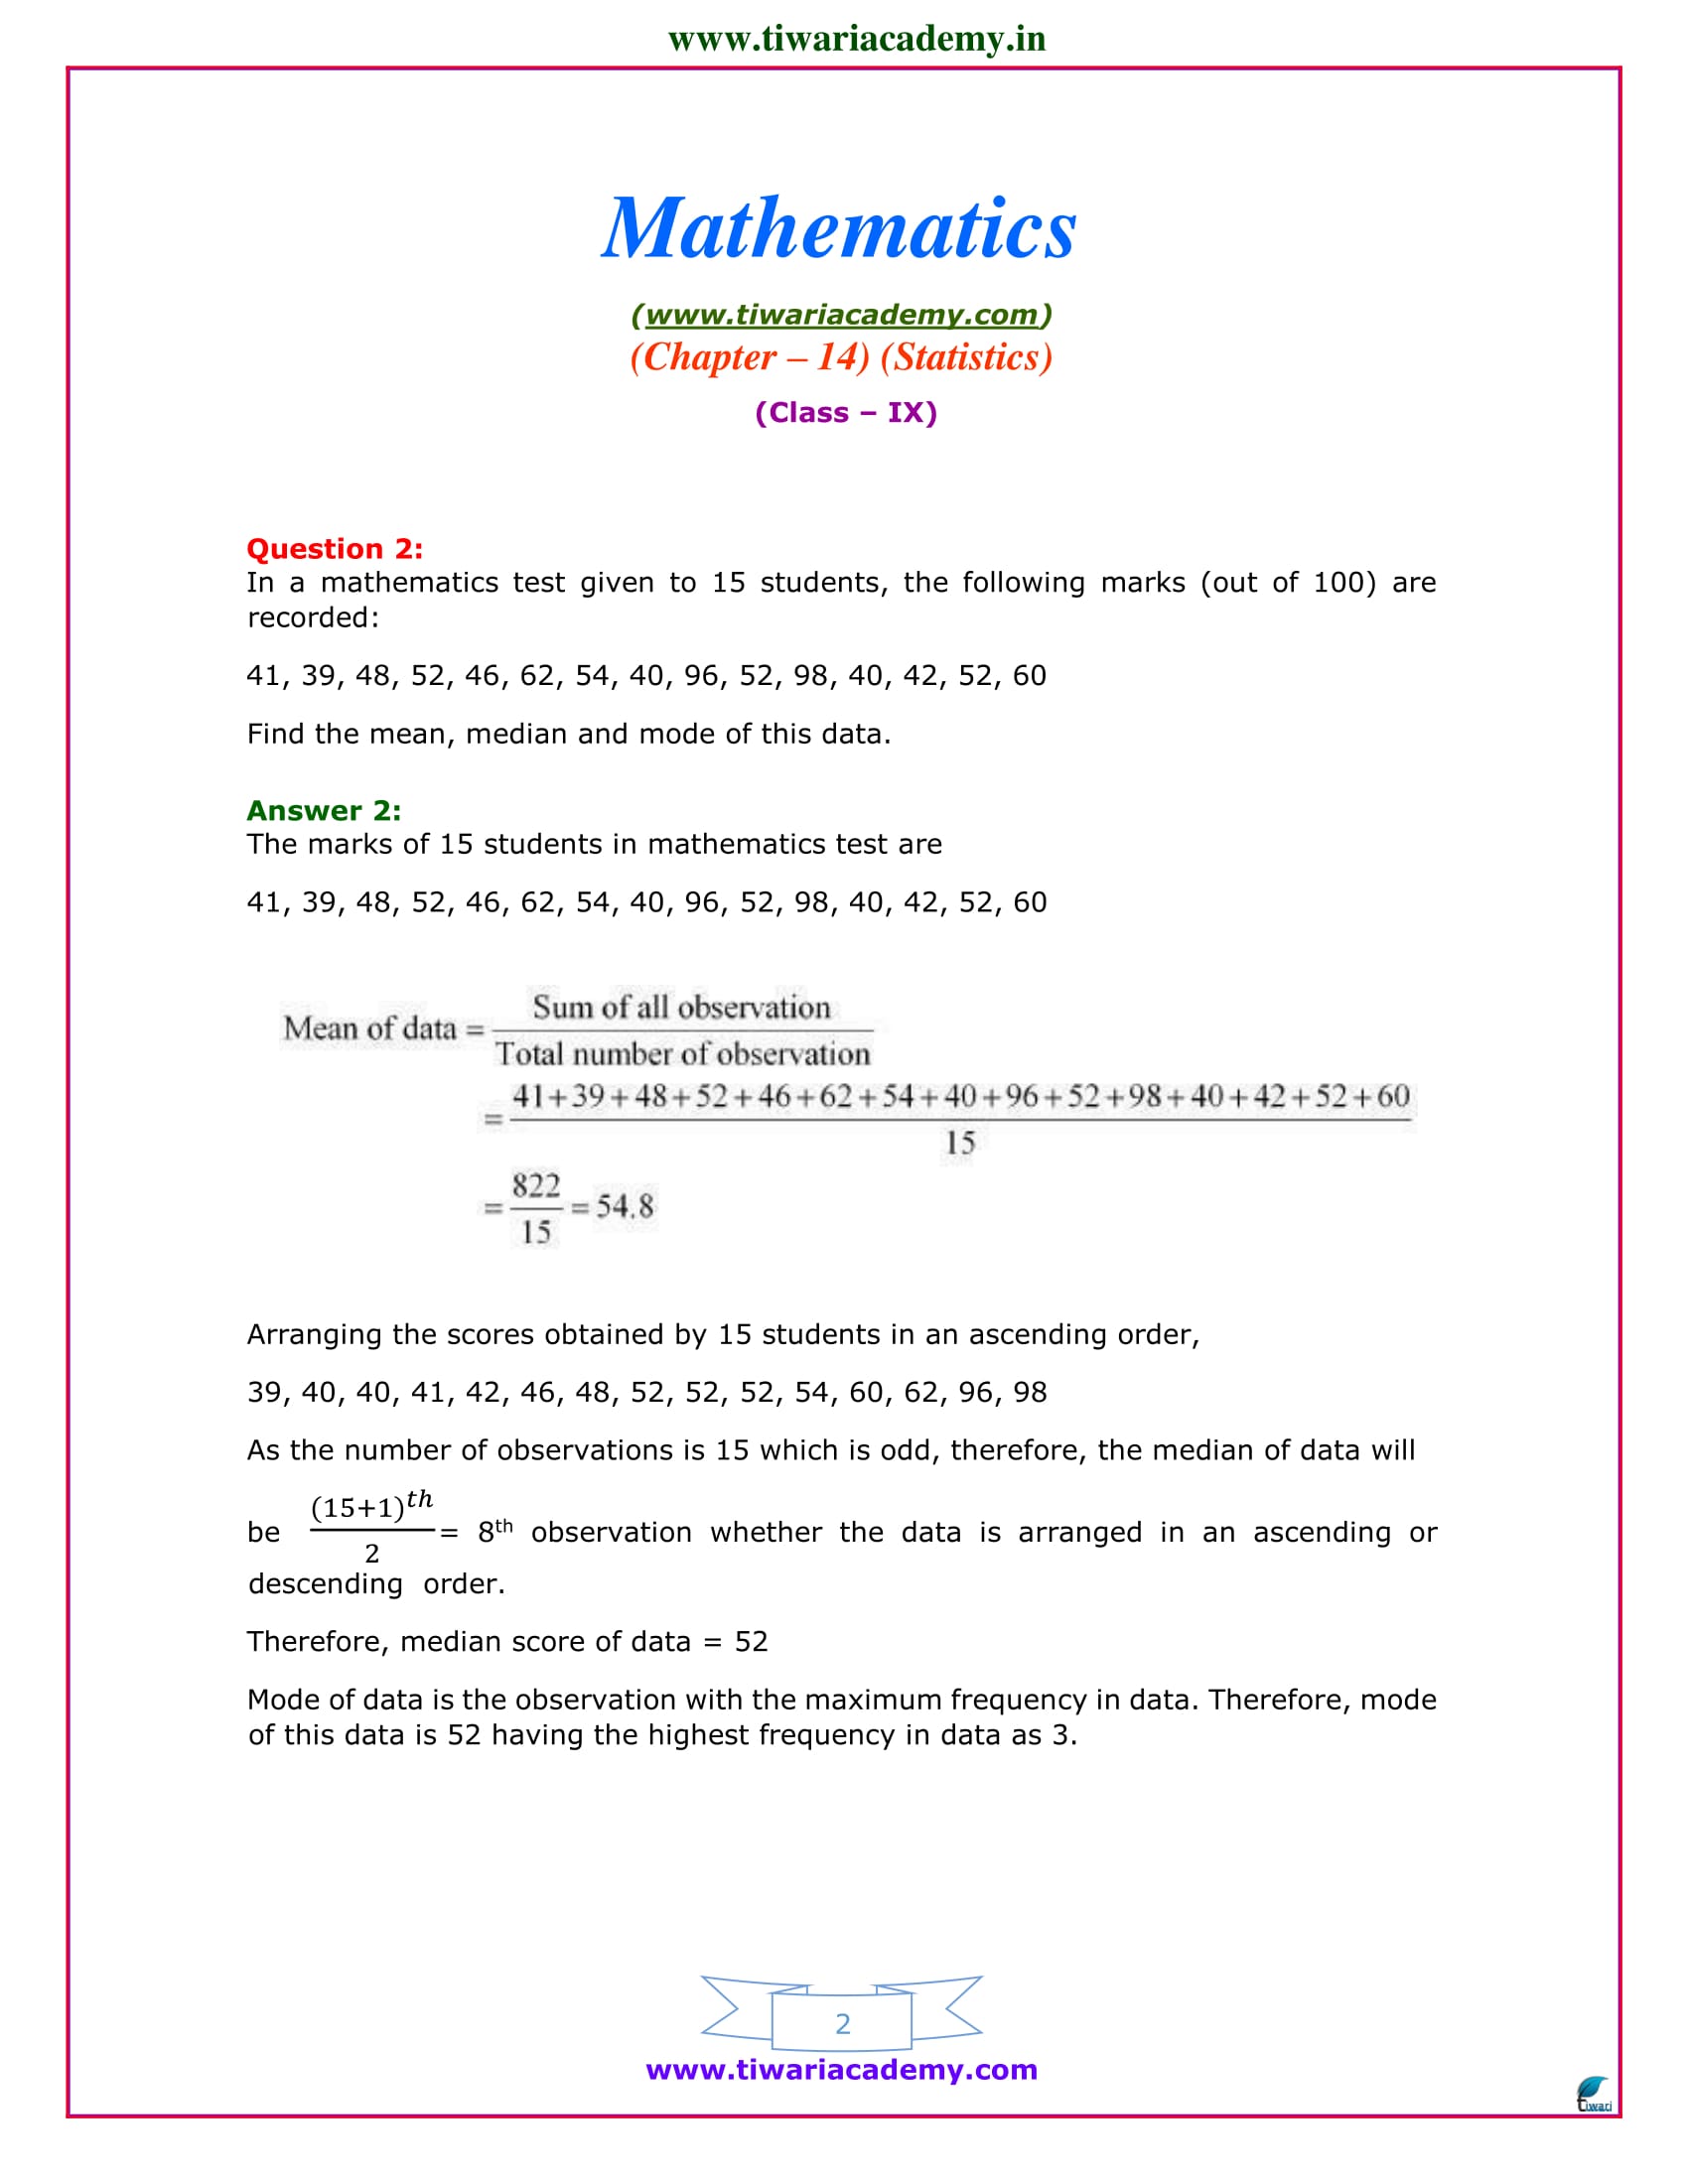
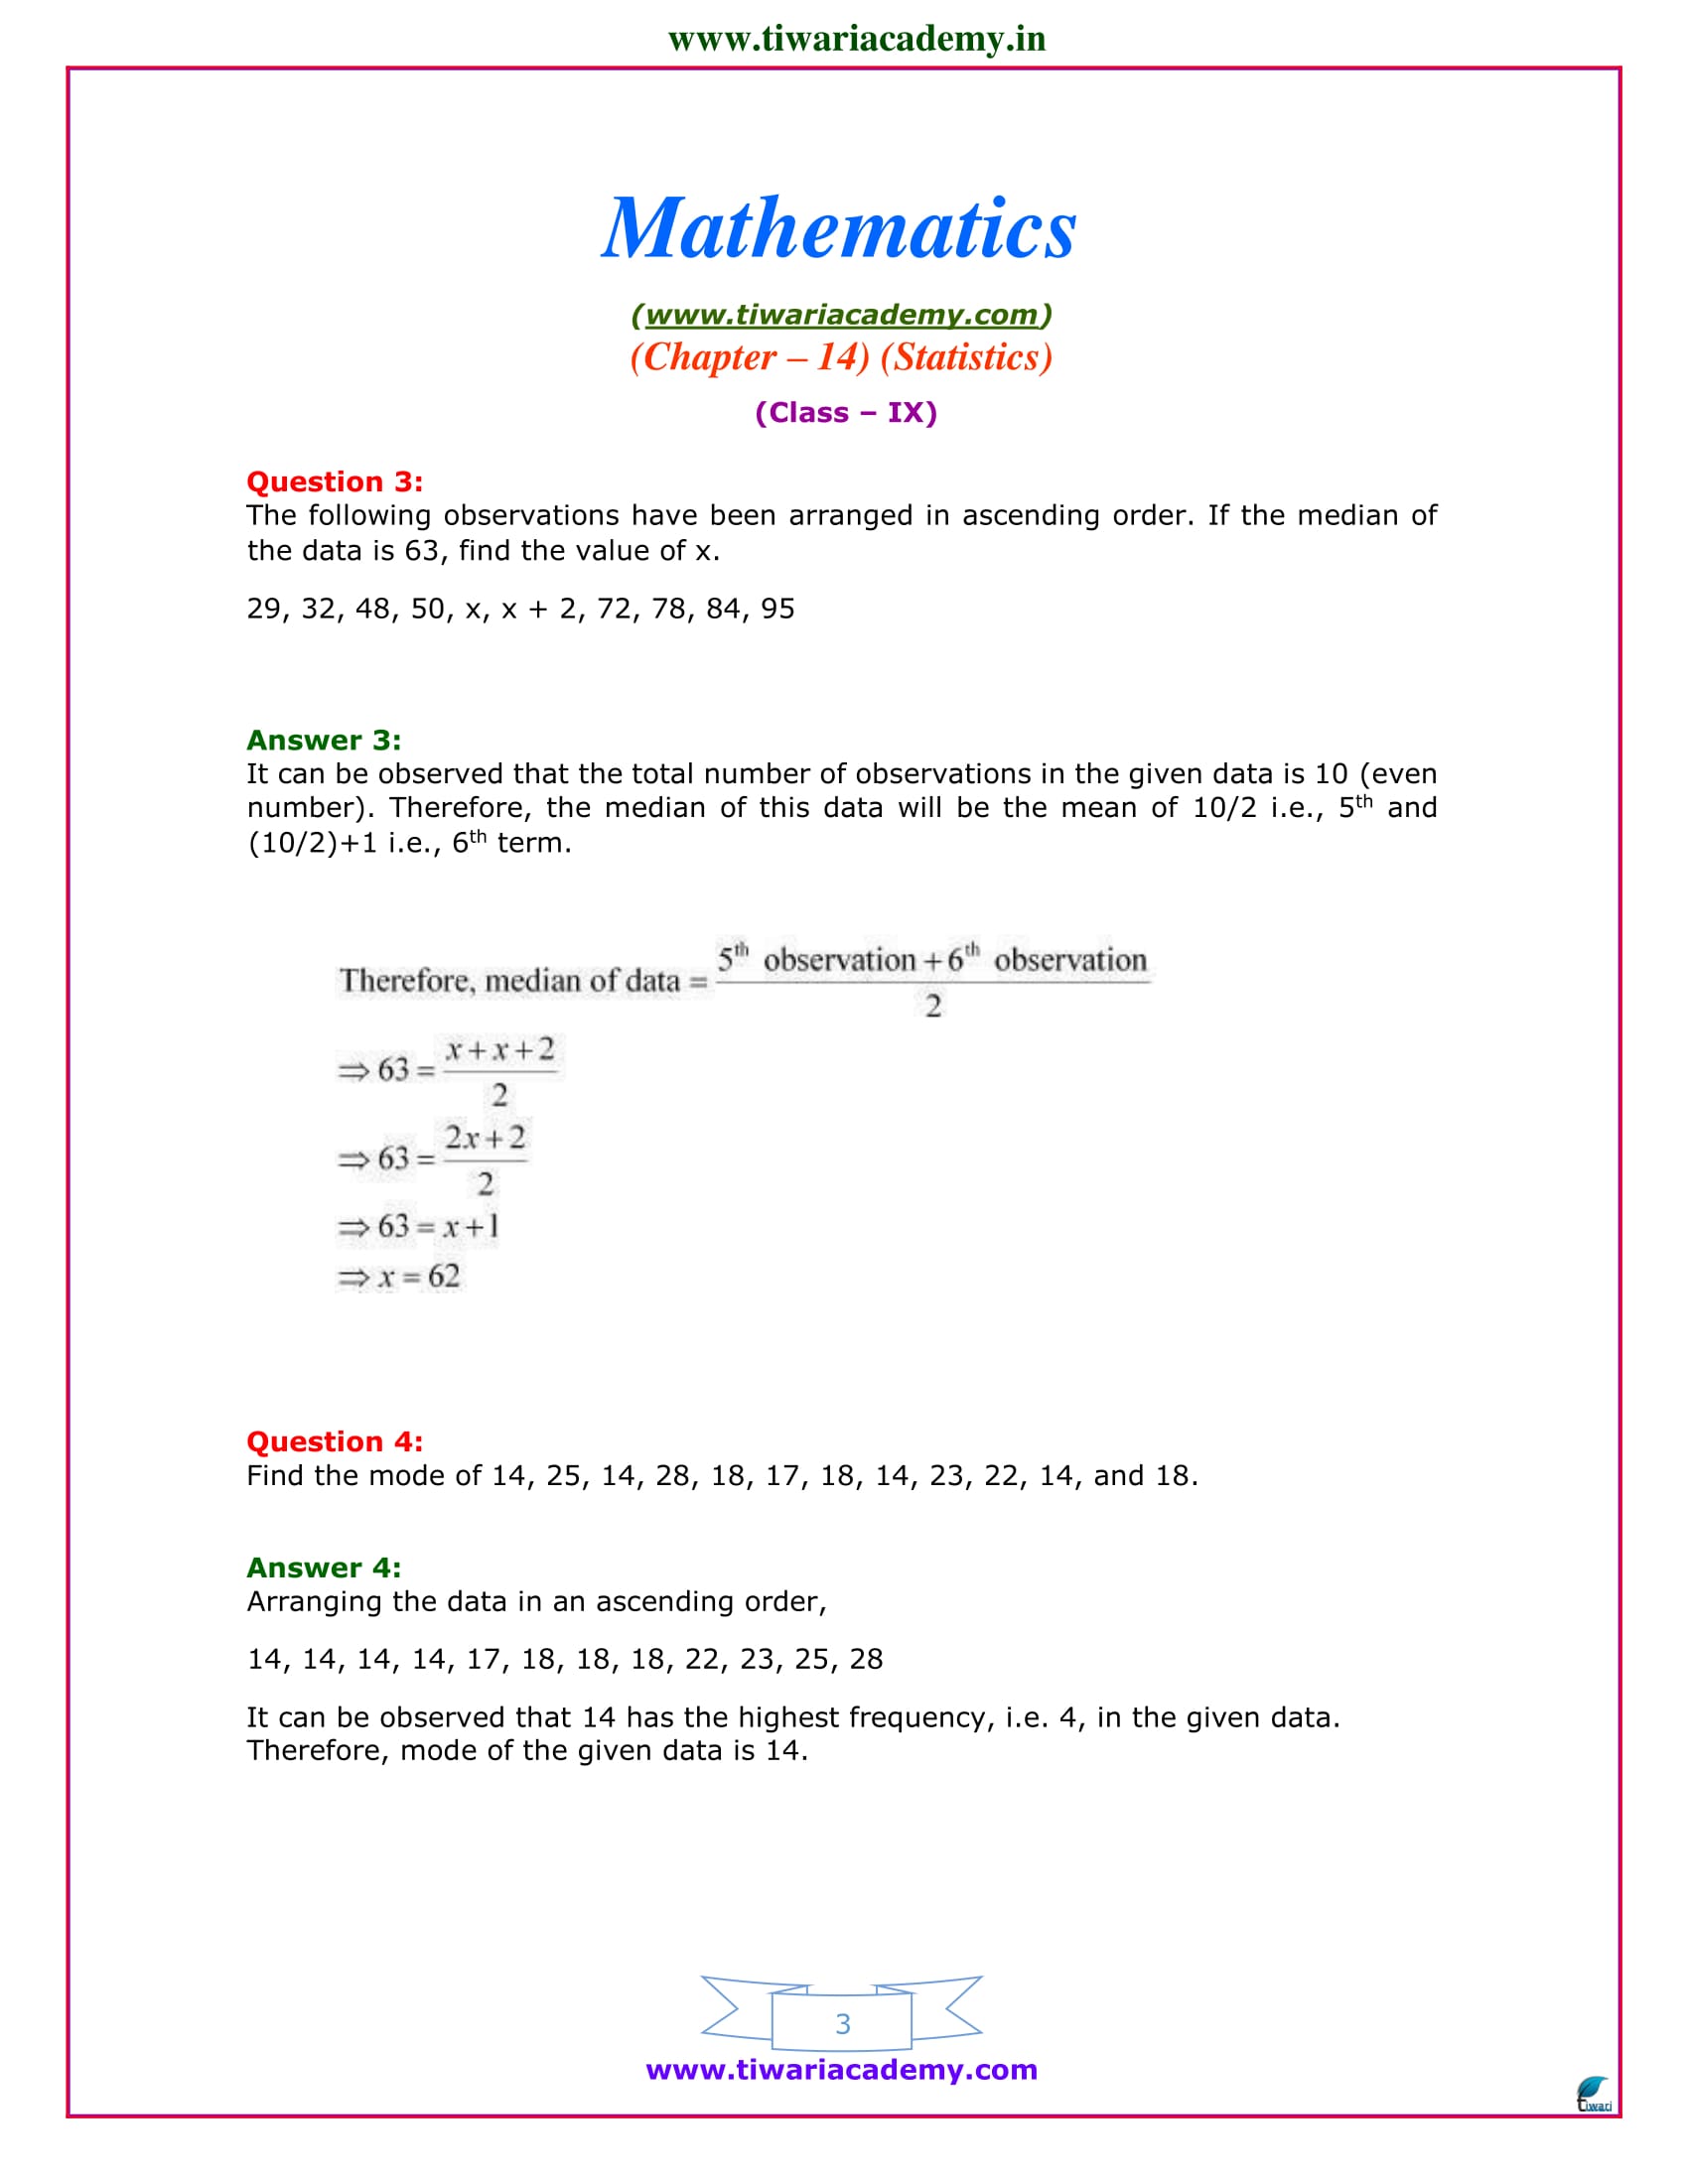
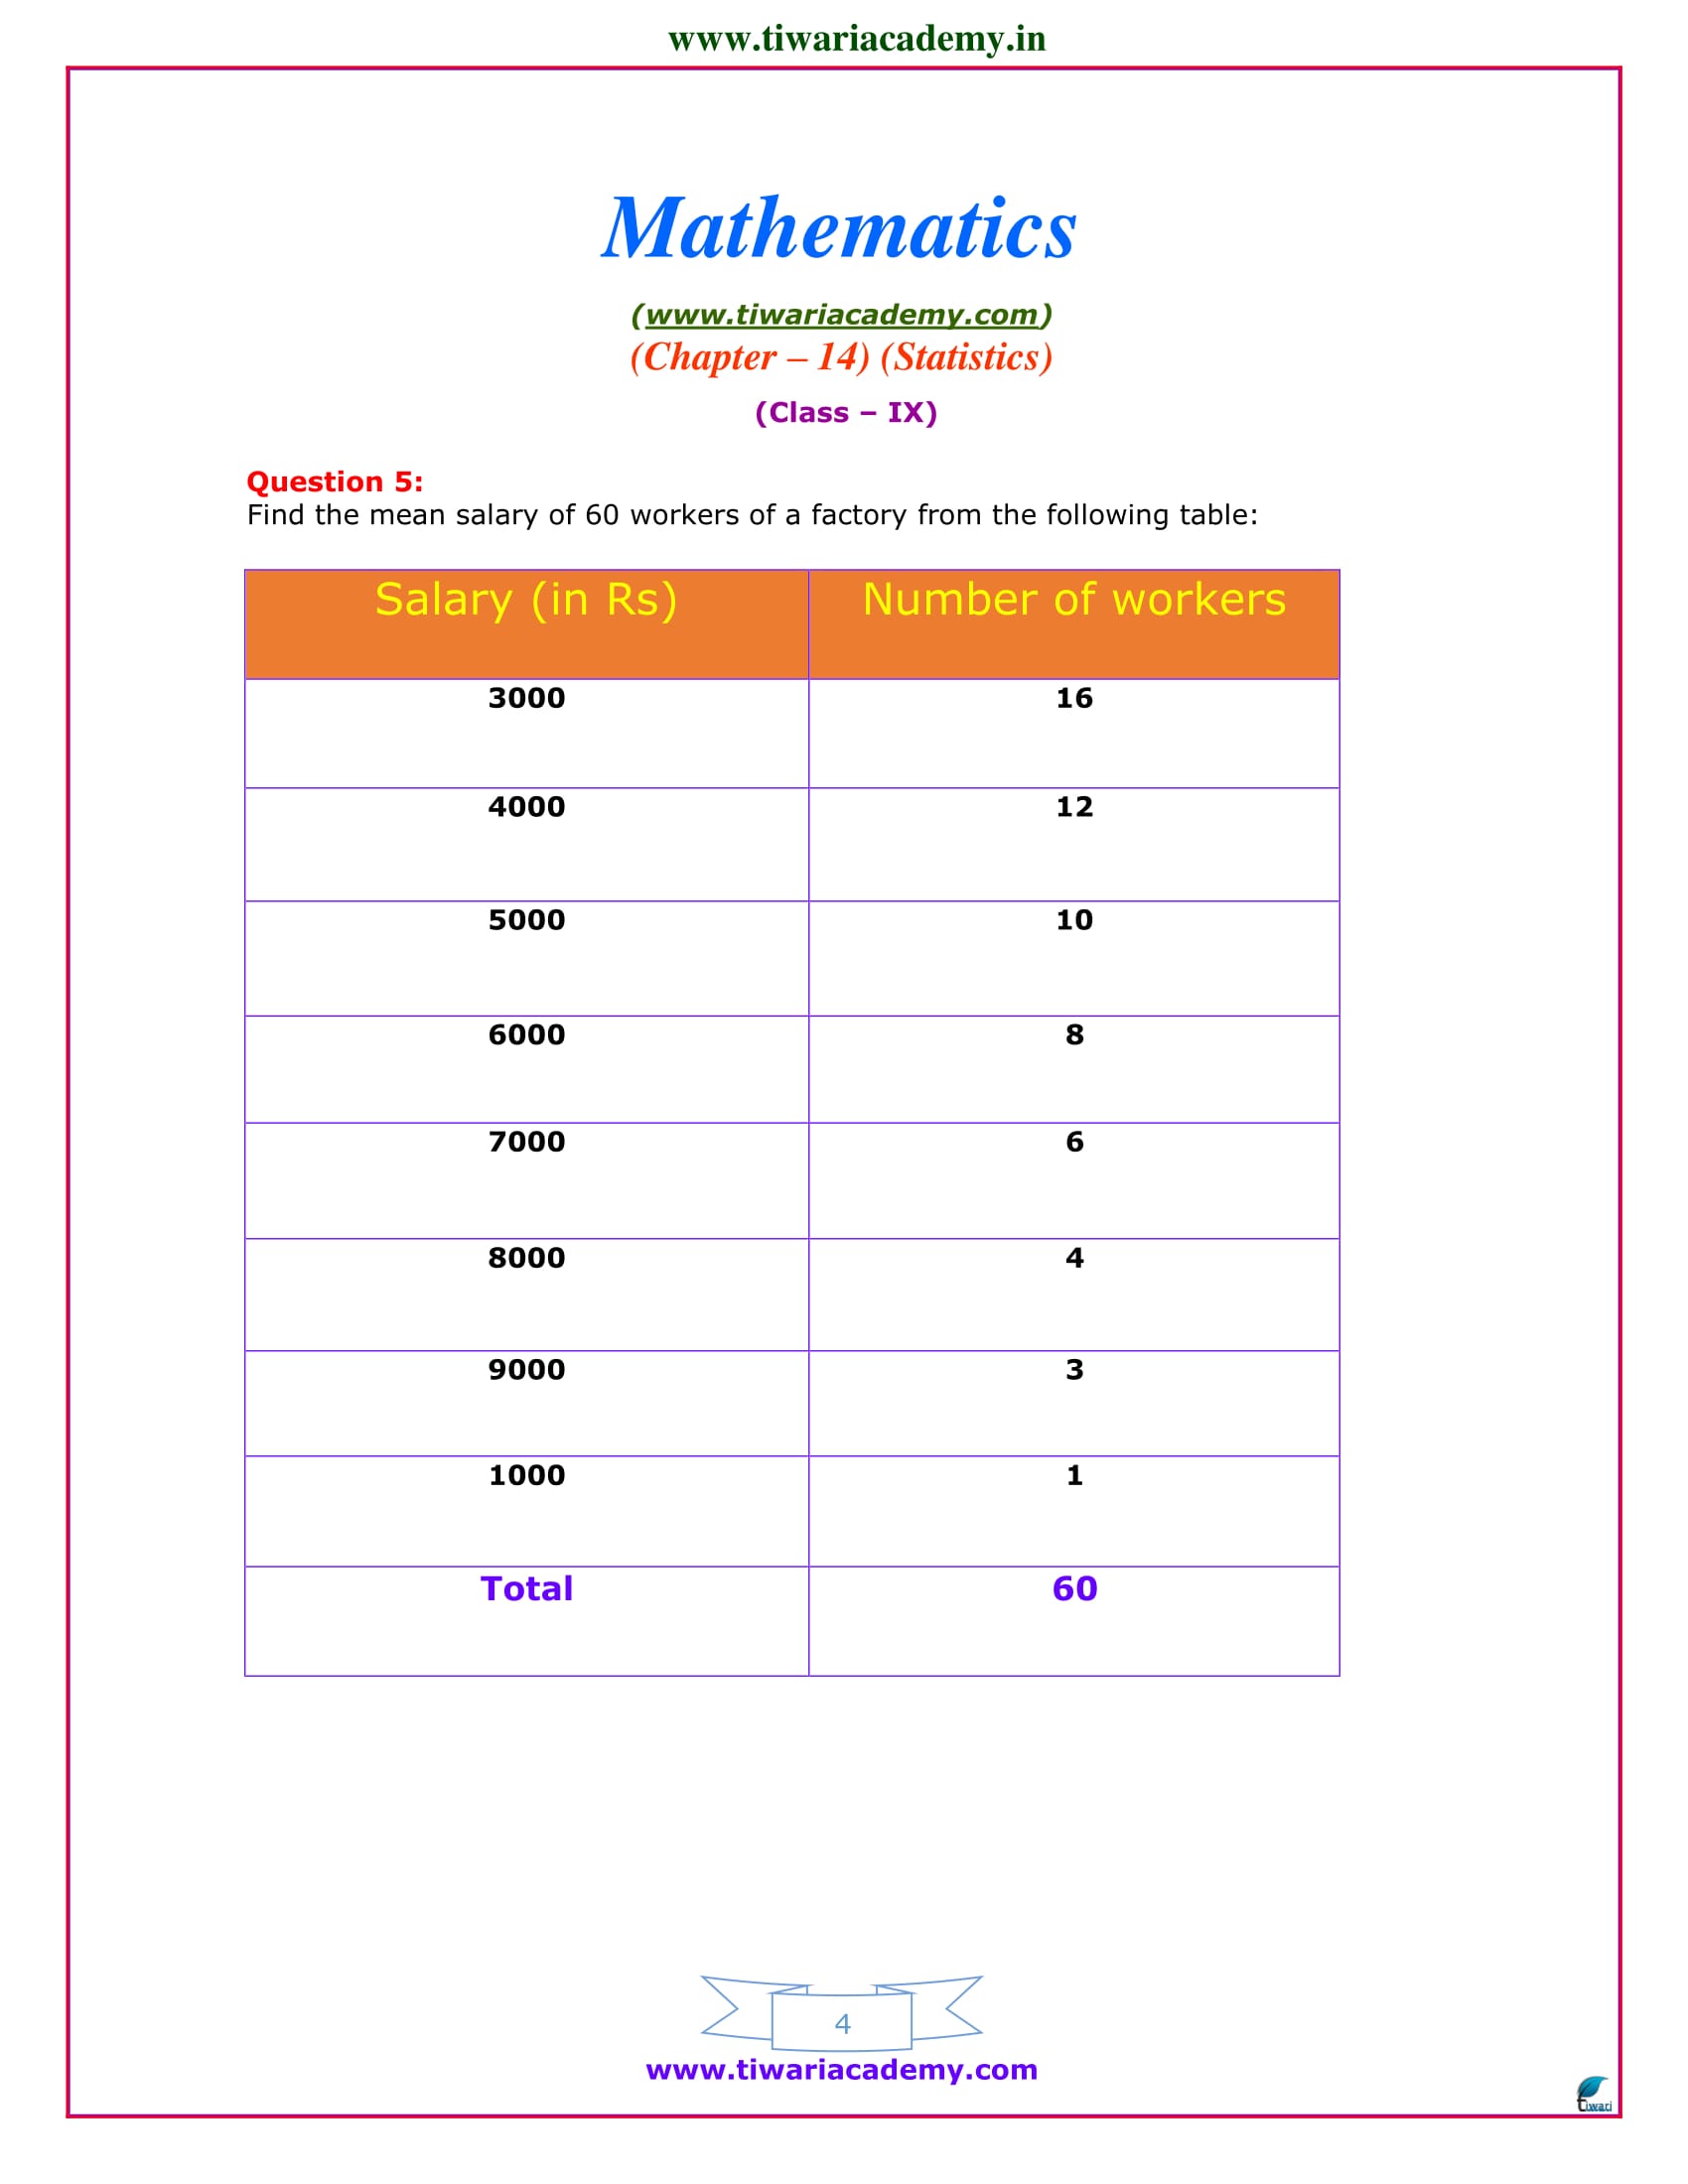
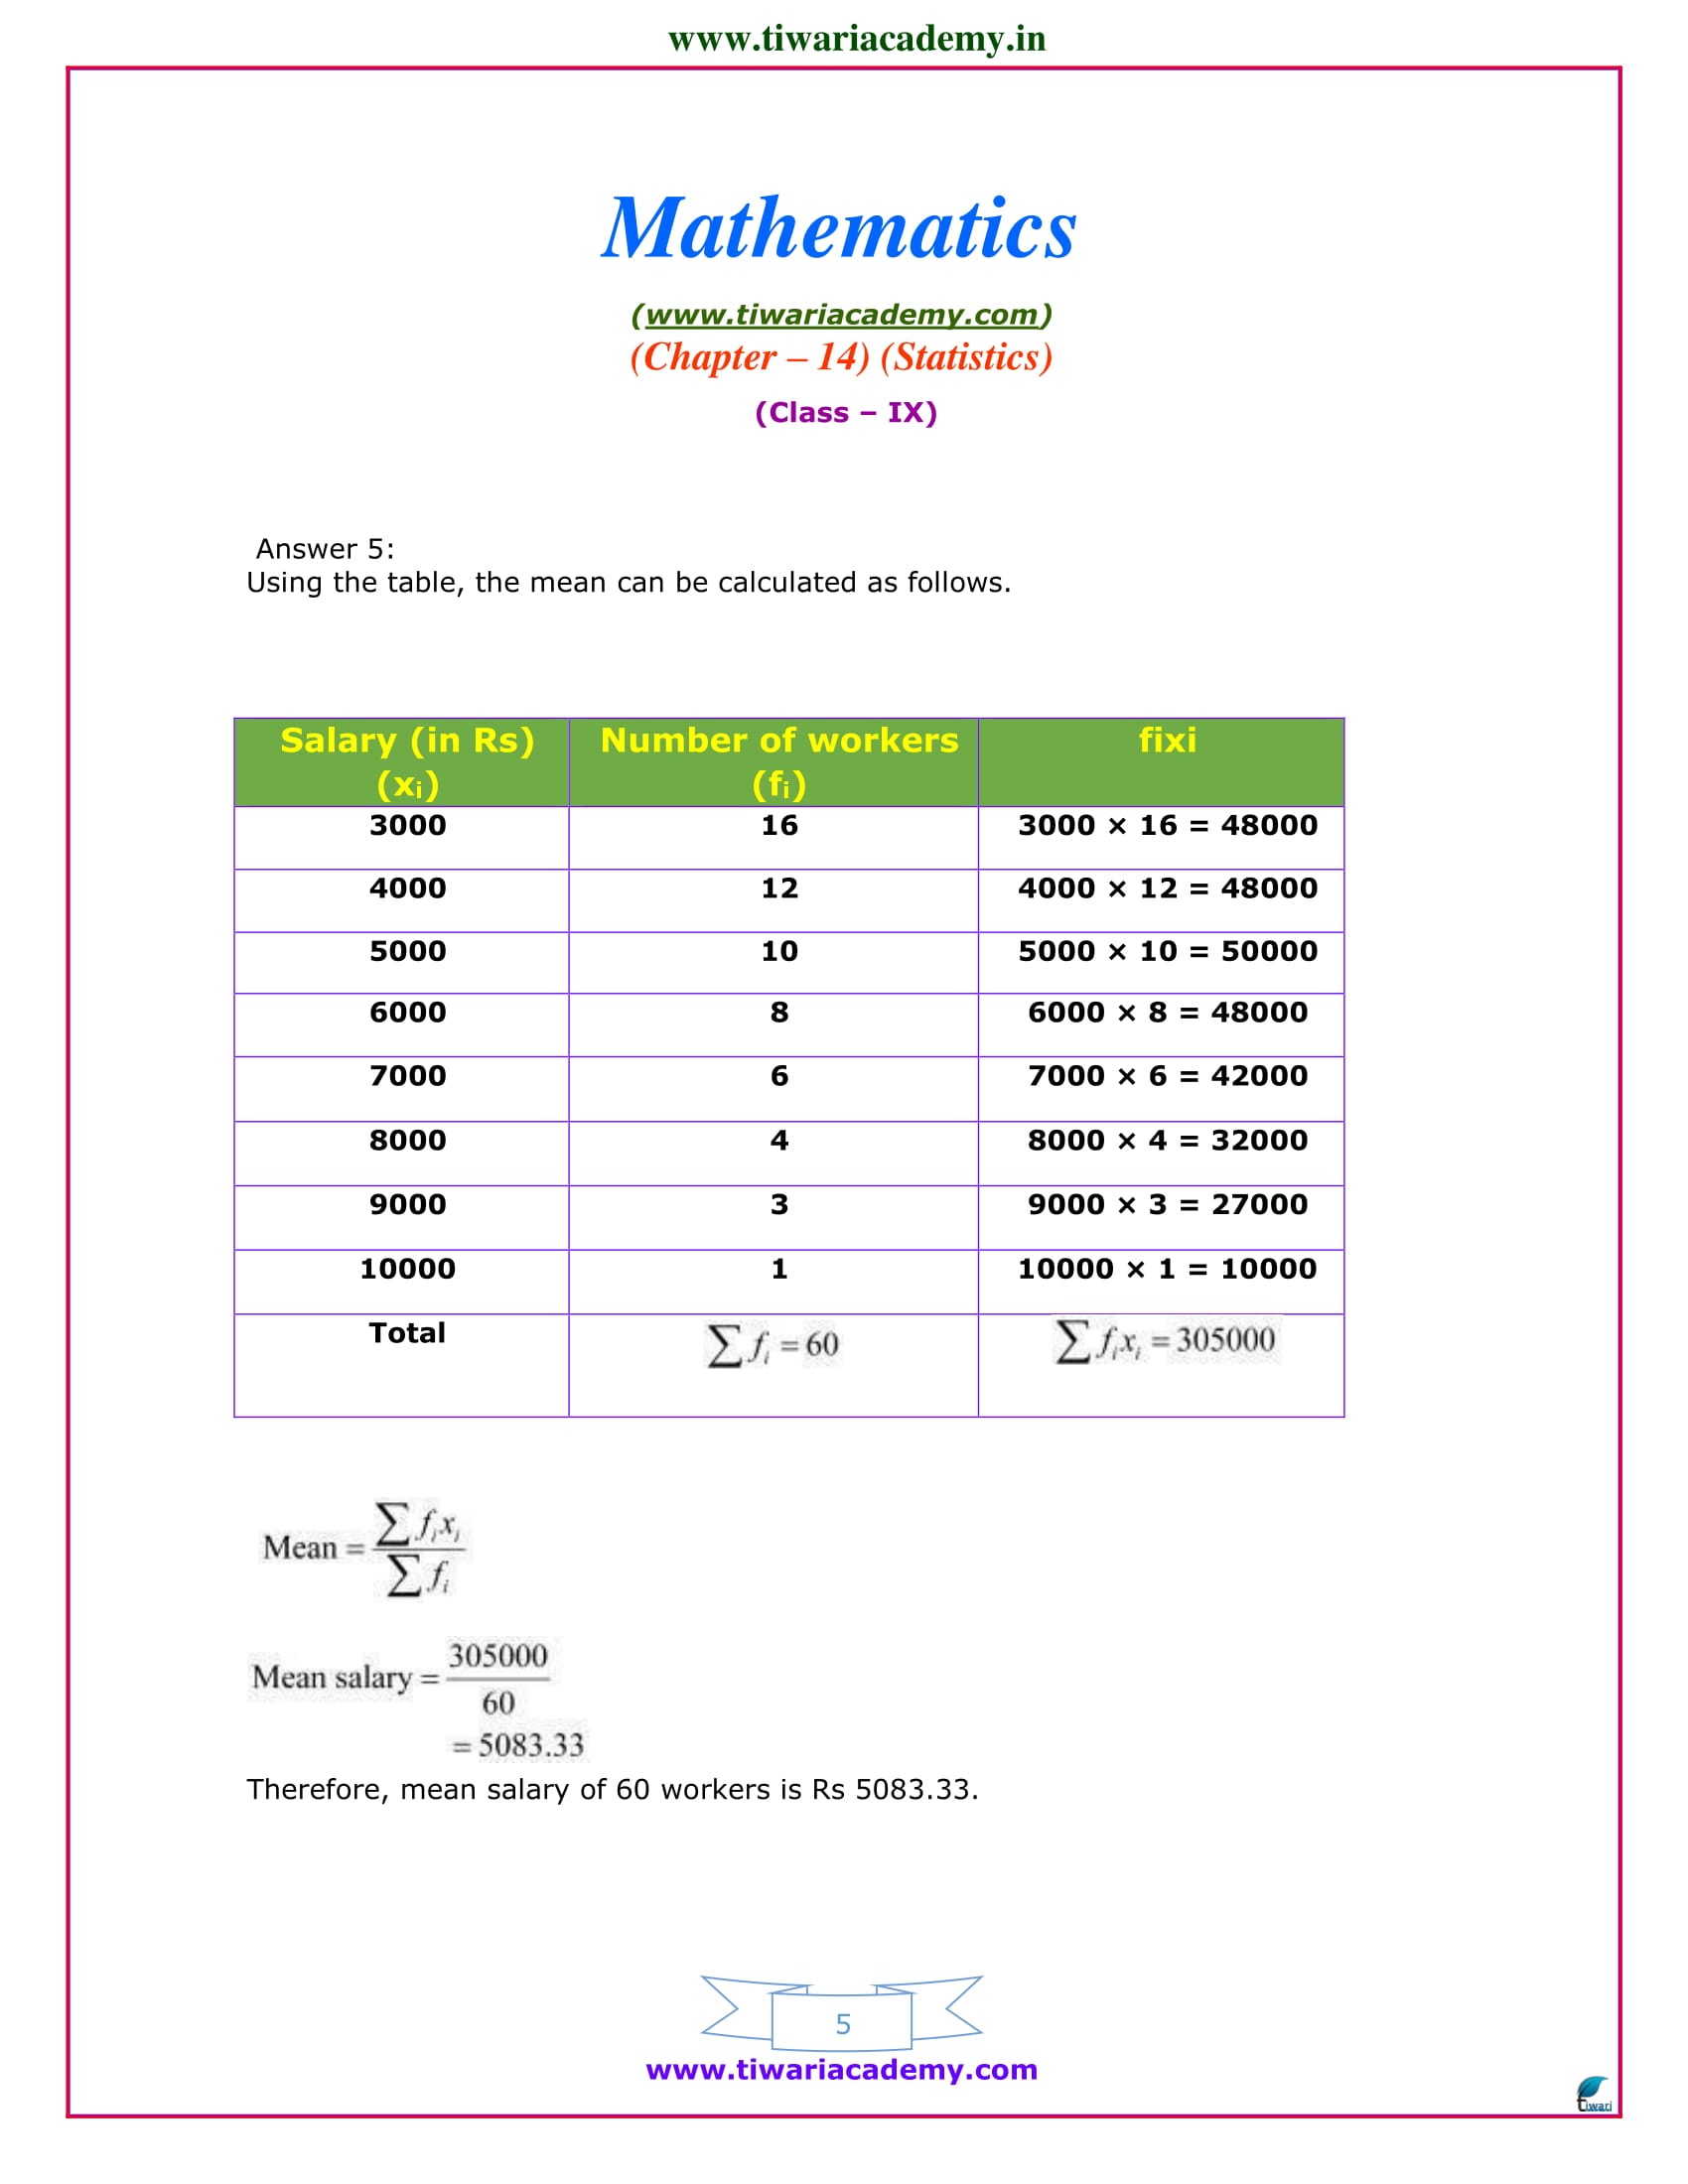
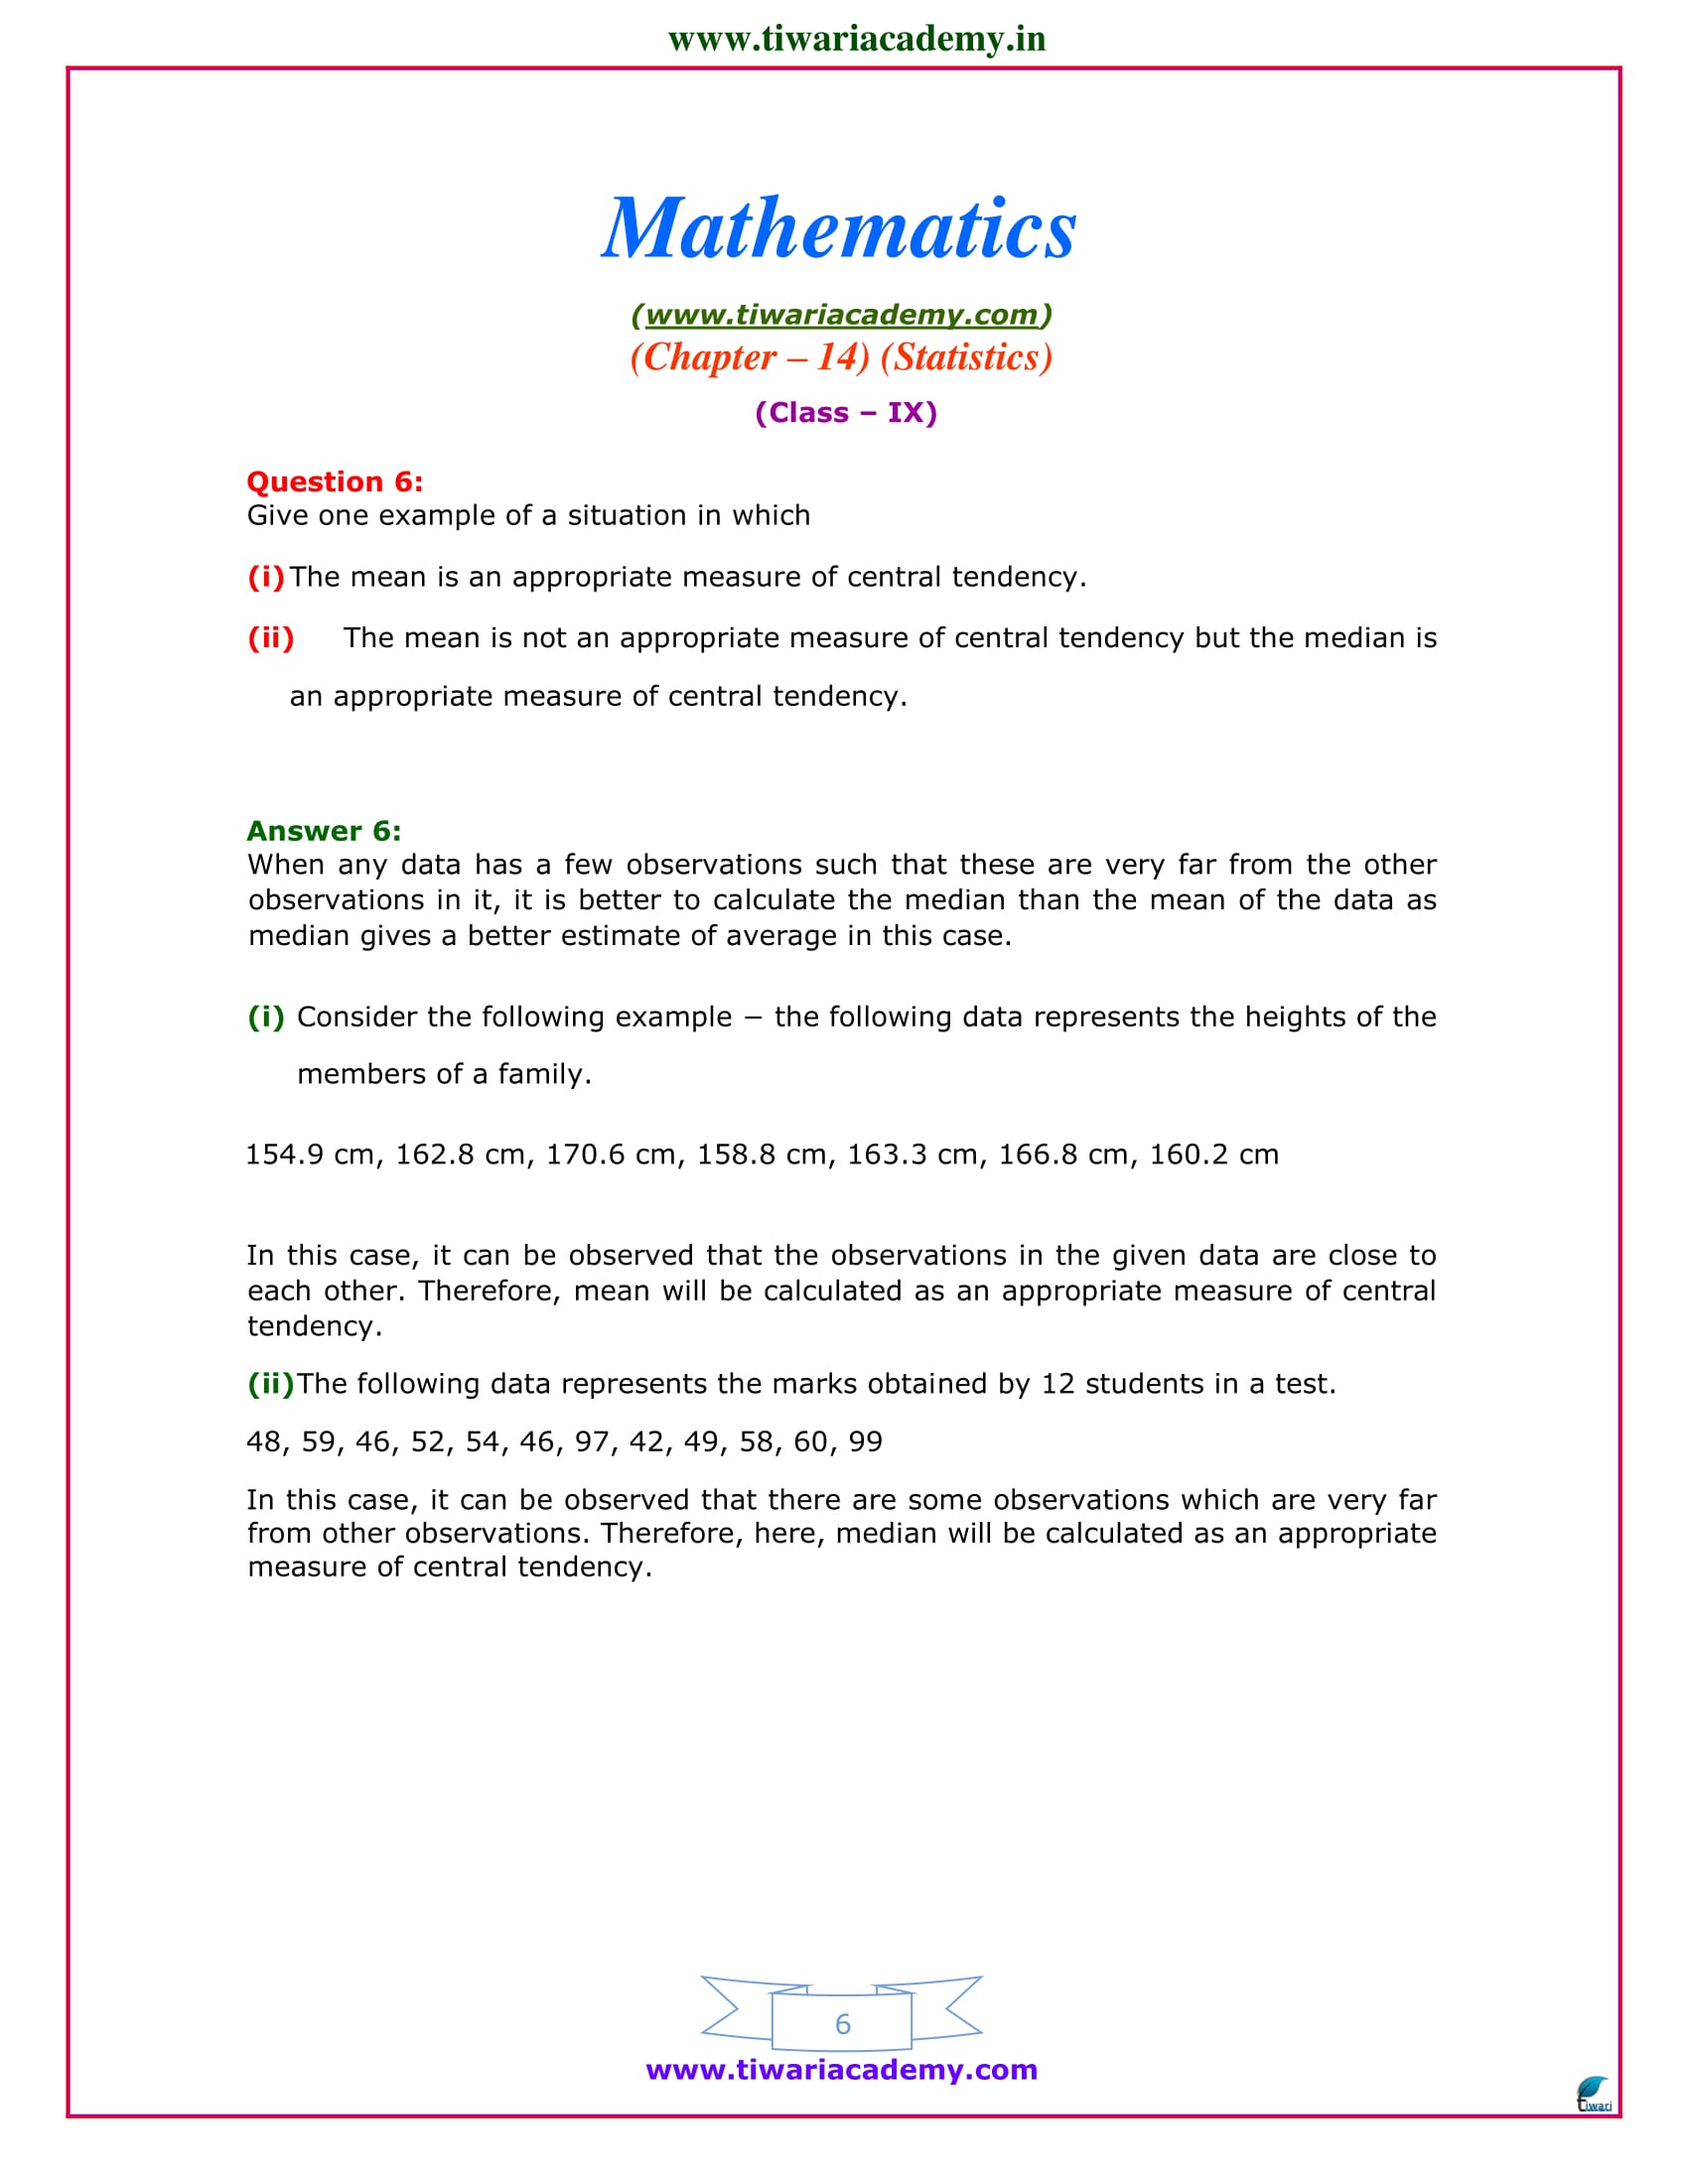
9 Maths Chapter 15 Exercise 14.4 in Hindi
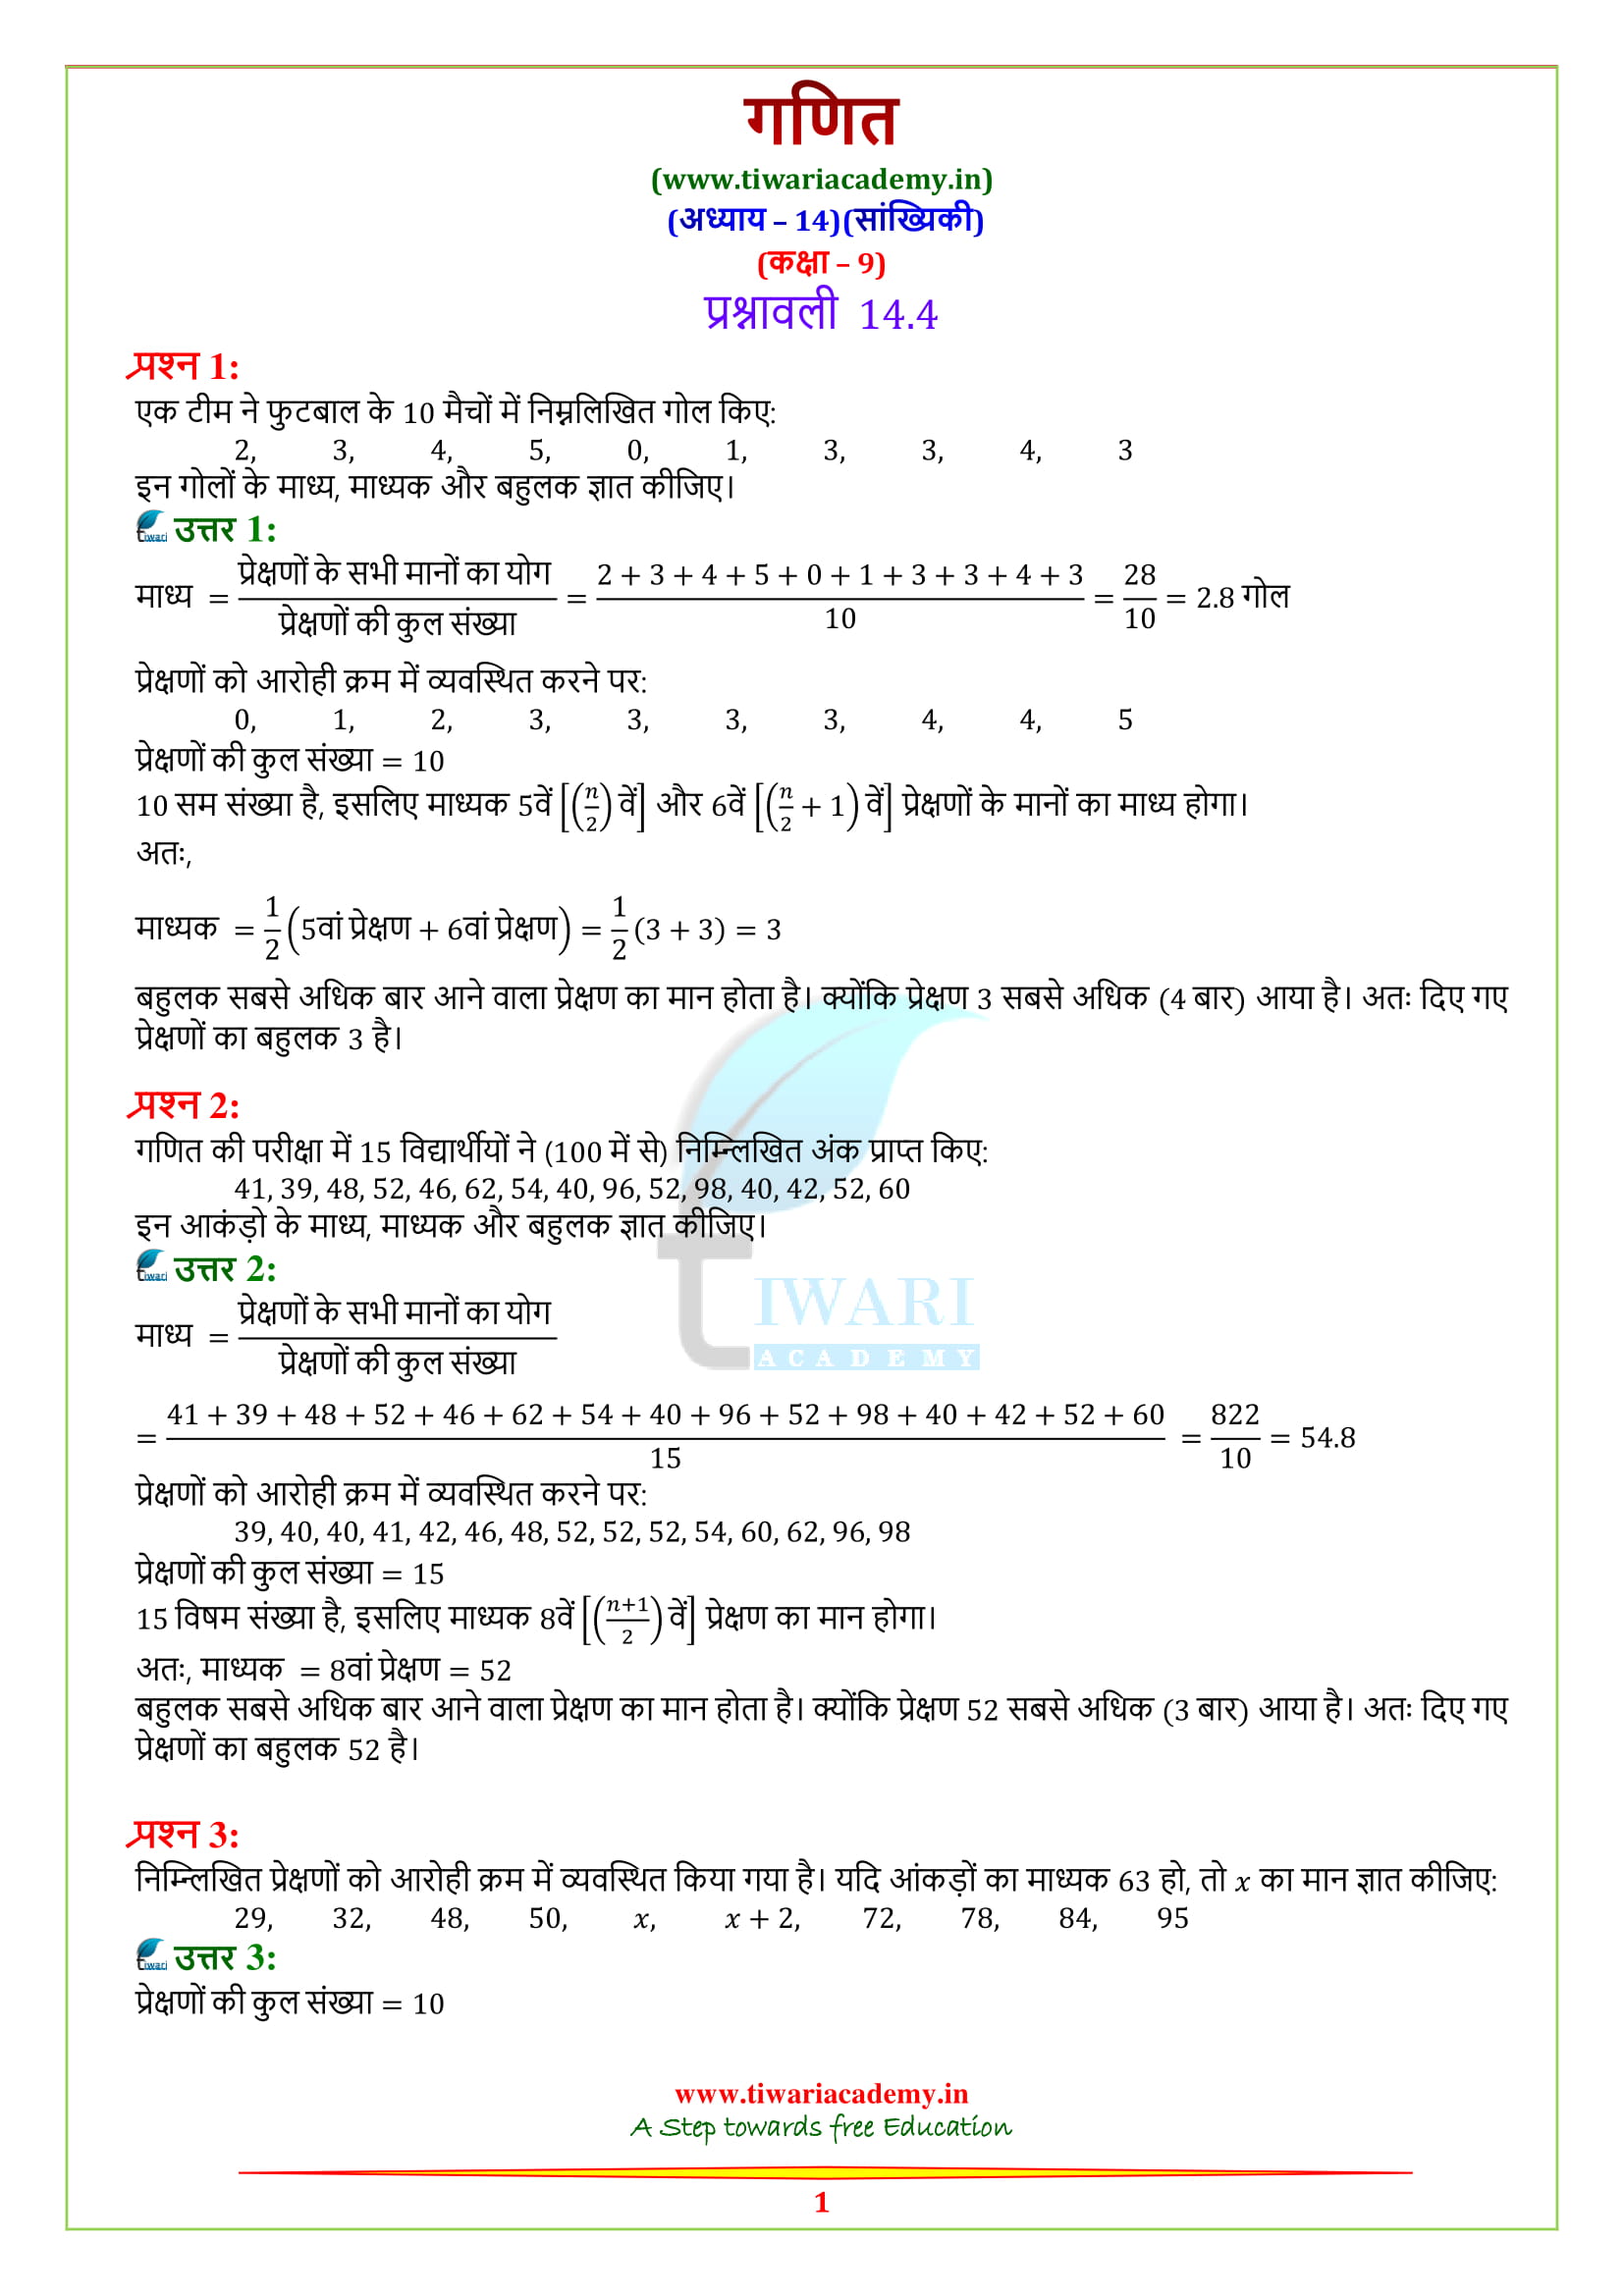
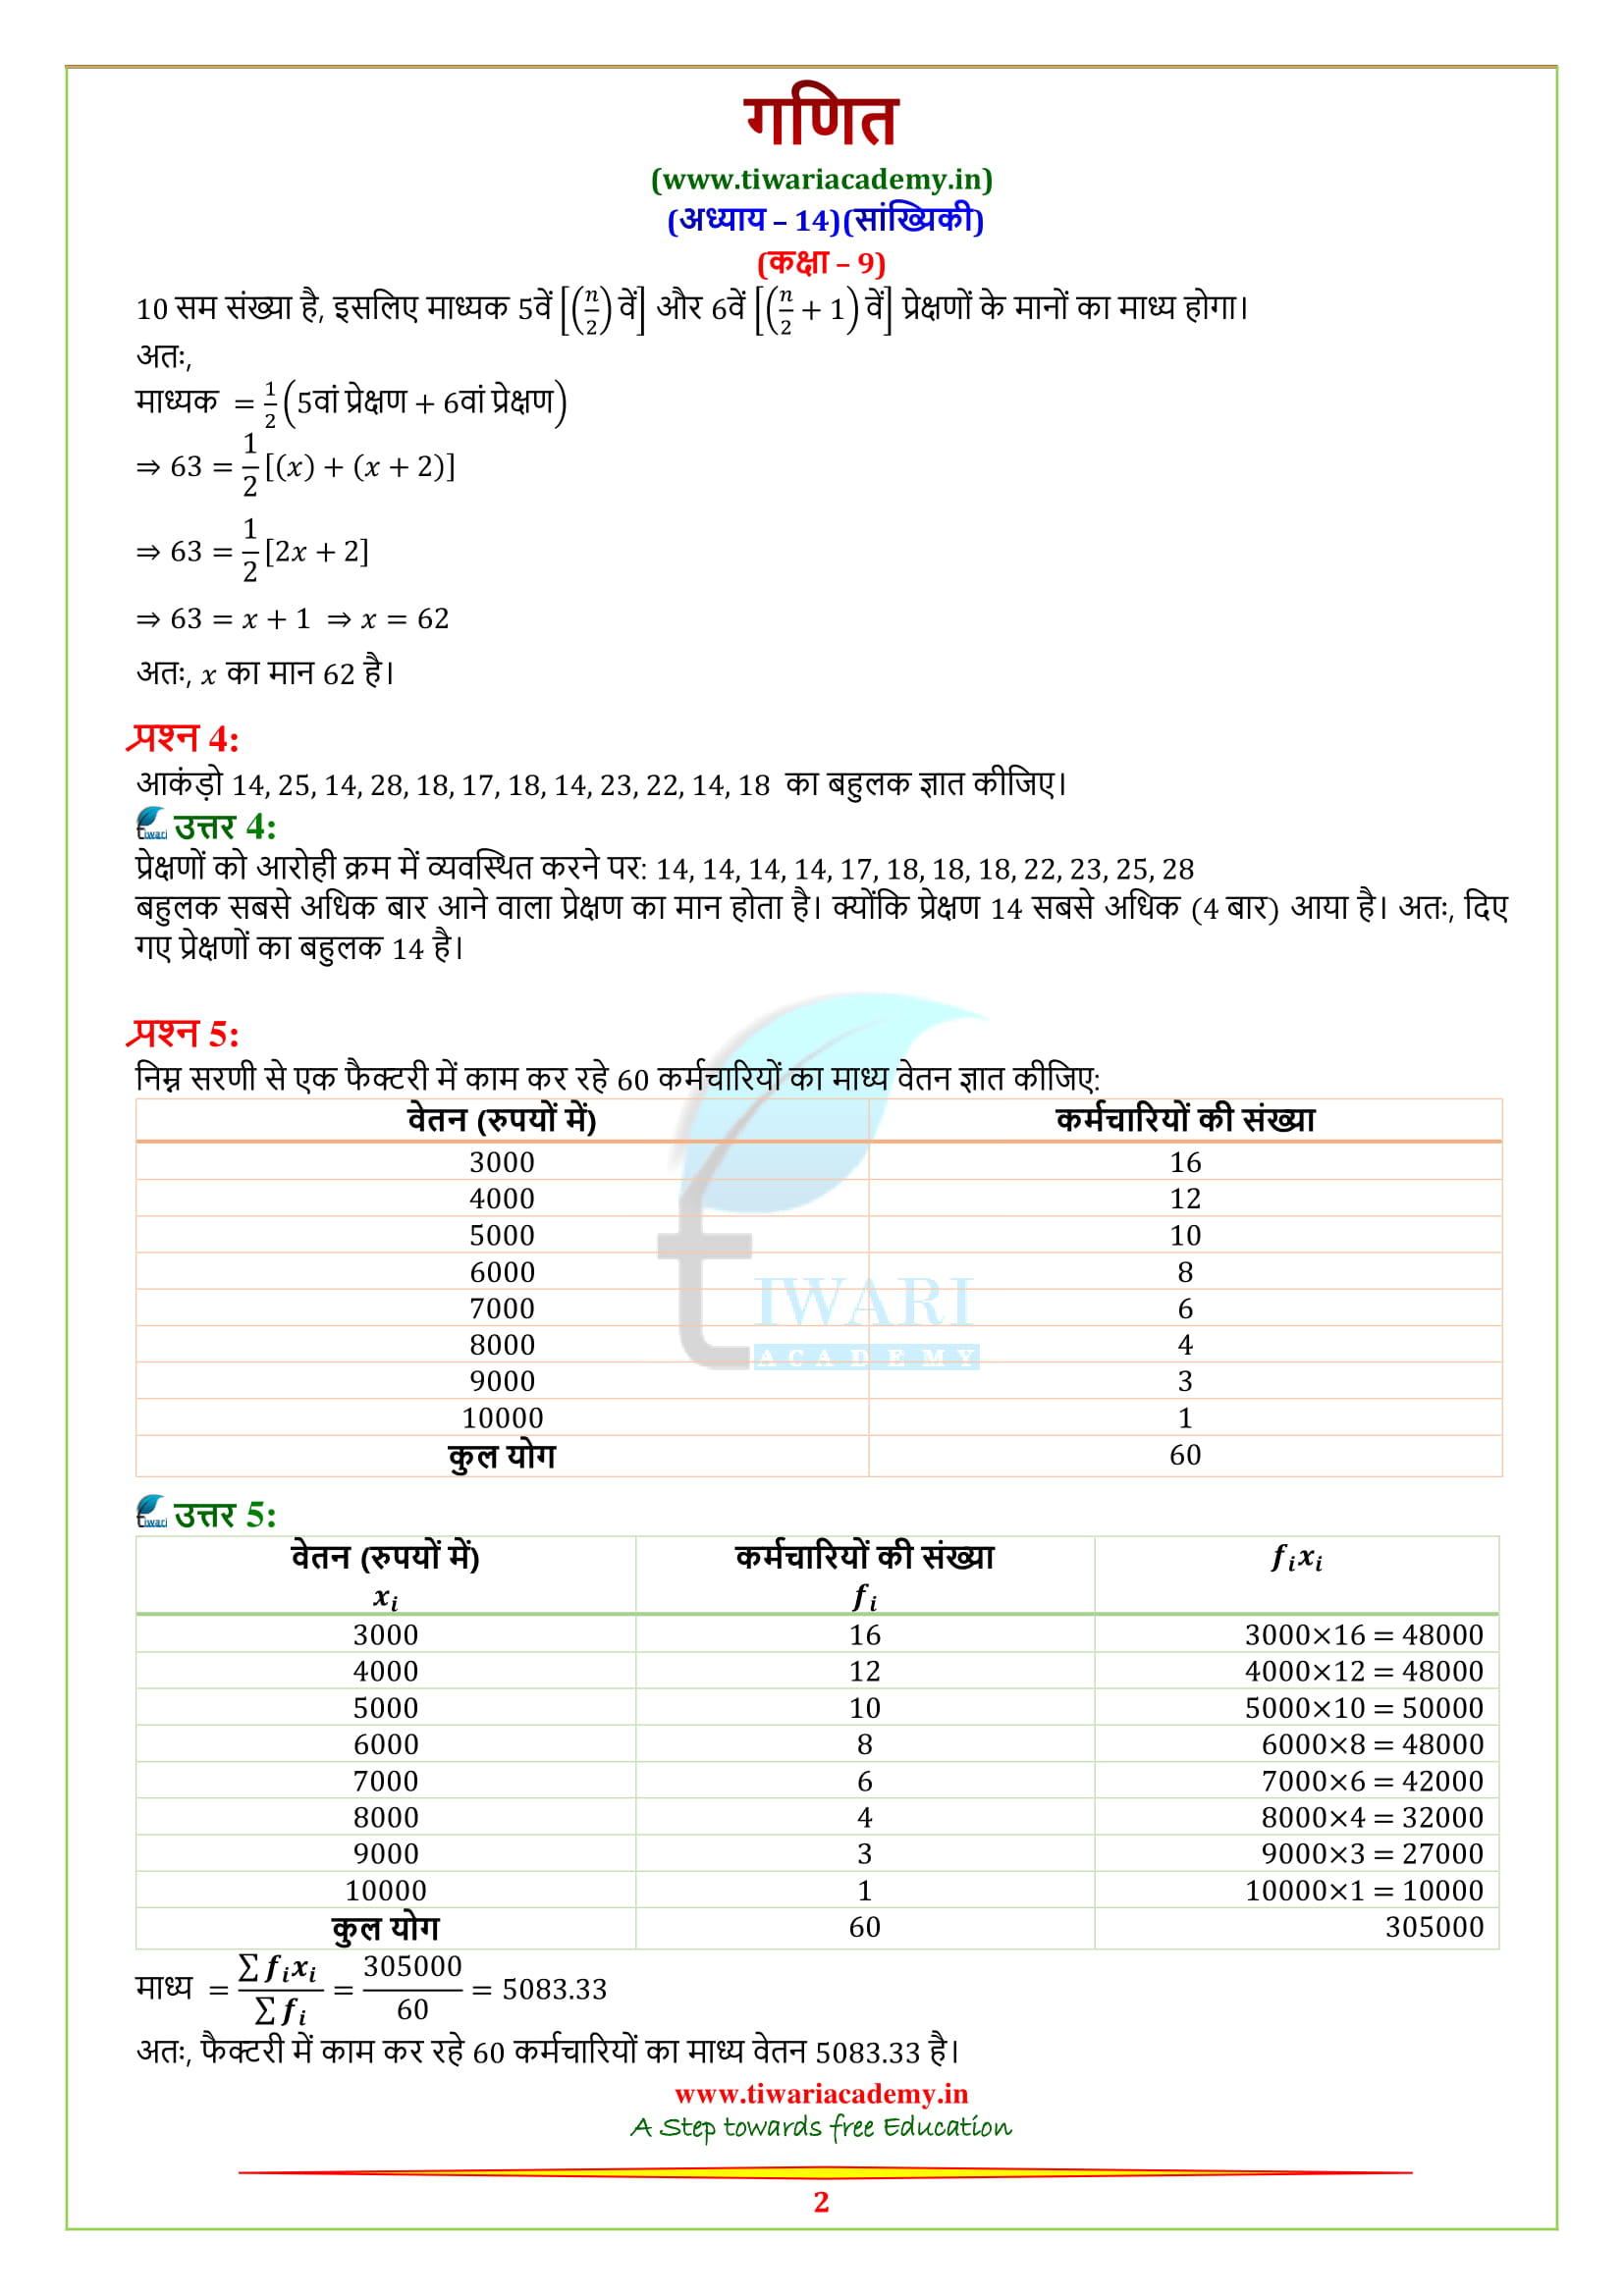
To get the solutions in English, Click for English Medium solutions.
Questions for Class 9 Maths – Statistics
Practice Questions with Answers
- The mean of the following data is 50.
xi 10 30 50 70 90
fi 17 5a+3 32 7a-11 19
Find ‘a’ and the mission frequencies for xi = 30, xi = 70. [Answer: a = 5 and missing frequencies are 28 & 24]
- Draw a frequency polygon for the following data:
Marks Frequency
0-10 03
10-20 09
20-30 18
30-40 16
40-50 12
50-60 02 - If the 26 English alphabets are such that A = 1, B = 2, C = 3… Z = 26 then find the mean and median of the numbers corresponding to the vowels, which alphabet corresponding to the median. [Answer: I]
- In a school a student who scored 80% or above in his/ her previous class is eligible for “Merit scholarship” Marks obtained by two students Nishi and Vinayak of class IX in their previous class (VIII) in all subjects are given below.
Name Hindi English Maths Science SSt. Skt.
Nishi 78 74 86 85 73 83
Vinayak 79 76 88 83 71 85
Find average percentage score of Nishi and Vinayak which of the two are eligible for merit scholarship? [Answer: 70.83, 80.33]
- The blood group of 30 students of class IX are recorded as follows.
A, B, B, B, O, B, B, A, AB, A, O, B, O, A, B ABAB, A, AB, B, A, O, AB, B, A, O, B, AB, A, AB.
a) Make a frequency distribution table for the above data.
b) Mr. ‘X’ meets an accident and needs blood. His blood group is AB. How many of these students can donate their blood to Mr. ‘X’?
c) How many of the above students are universal donors and universal acceptors? [Answer: (a) 30, (b) 6, (c) 8]
- 15 students of Govt. school spend the following numbers of hours in a month for doing cleaning in their street 25, 15, 20, 20, 9, 20, 25, 15, 7, 13, 20, 12, 10, 15, 8.
i) Find mean, Median and mode from above data.
ii) Which value is depicted from above information? [Answer: Mean = 15.6, Median = 15, Mode = 20, Social Work]
- In an assembly election the number of seats won by the different political parties is shown below.
Party A B C D E F G
No. of Seats 1 4 7 15 2 19 15
i) Draw a bar graph.
ii) Which political party won by availing maximum number of seats.
iii) What is the minimum age of a voter to cast his/ her vote in India in assembly election?
- The following table shows no of voluntary blood donor as per day in voluntary blood donation camp organized by Govt. of Delhi.
Days No. of Donors
Sunday 100
Monday 80
Tuesday 110
Wednesday 80
Thursday 60
Friday 70
Saturday 120
Draw a bar graph showing above information.
i) In which day donation was maximum and in which day it was minimum.
ii) Why blood donation is necessary?

